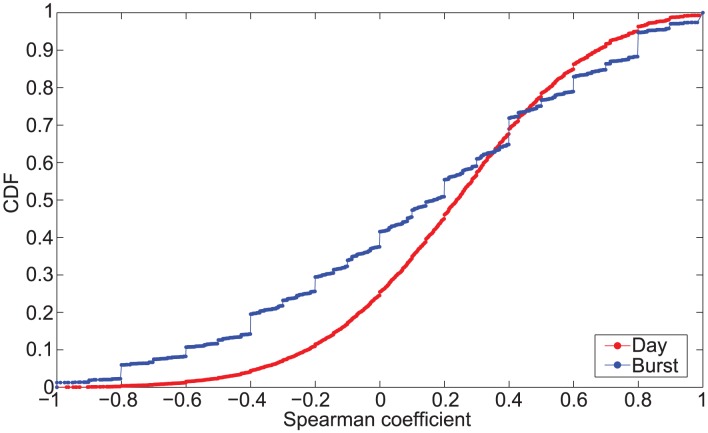
Figure 4. Distribution of Spearman correlation coefficient.
CDF of the Spearman correlation coefficient computed on D 2 considering sequences with more than three distinct receivers. We report the distribution for both day (mean 0.21, median 0.24 and std 0.36) and burst (mean 0.12, median 0.17 and std 0.50) level.

