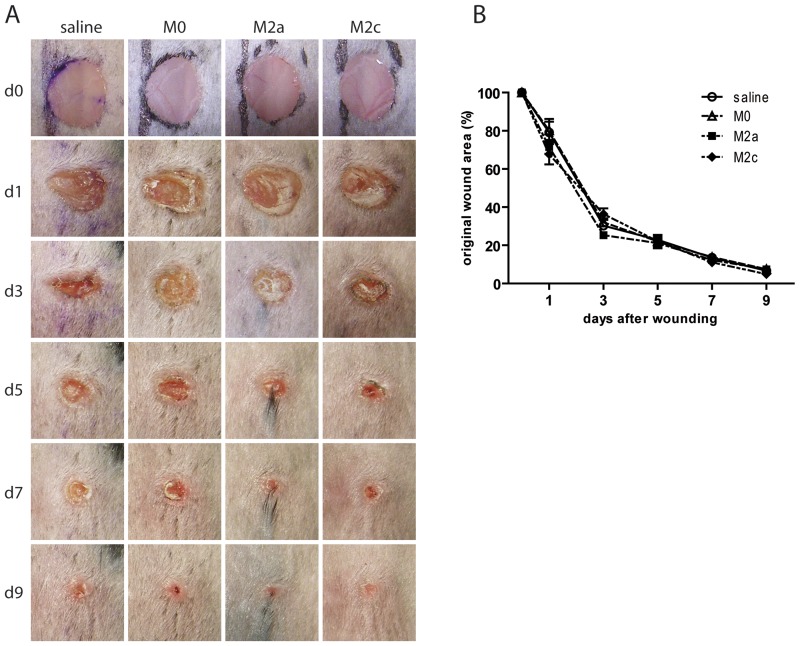
Figure 3. Wound healing in M2 macrophage injected wounds generated in C57BL/6 mice.
(A) Macroscopic appearance of representative saline, M0, M2a, and M2c injected wounds. Day 0 pictures were taken immediately after wounding. (B) Quantification of wound closure rate. At the indicated days, wound areas were determined using image analysis and expressed as percentage of wound area immediately post-injury as described in methods (n = 6 mice/group). Statistical significance was evaluated with a two-way ANOVA with Bonferroni post-test.

