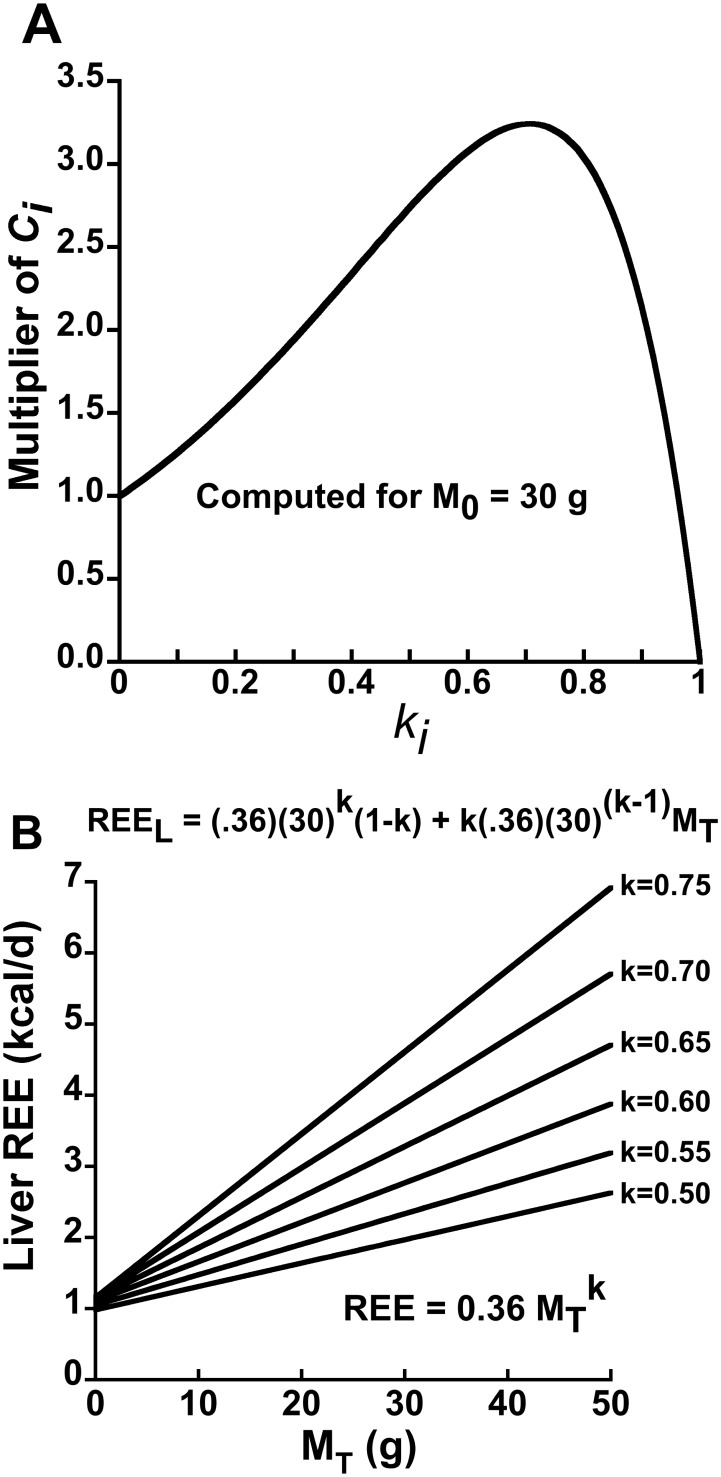
Figure 3. Influence of the organ-tissue scaling exponent  on an organ-tissue’s contribution to the positive y-intercept and to REE in linear models.
Panel A depicts the contribution to the y-intercept by the i-th individual organ-tissue REE in terms of  , where
  is the value of total body mass about which the Taylor linearization is performed. The contribution to the y-intercept is expressed as a multiplier of
  calculated as
  . The individual organ-tissue’s contribution to the y-intercept is maximized given a fixed numerical value of
  when
when  is ∼0.70 for an animal with
  = 30 g, as predicted by Eq. 12. Importantly, there is a substantial range of
  values that more than double
  . Panel B depicts the hypothetical effect of varying the
  value on both the y-intercept and slope of the hypothetical liver REE –
  relationship assuming that the allometric scaling coefficient
  remains fixed at 0.36
 (rescaled from 22.6
  , the value reported by [27] and depicted in Figure 2A). Note that the sensitivity of the slope to variation in
  suggests that group differences in the
  of the liver, a small organ with a big impact on whole-body REE, could contribute to the problem of differing between-group slopes of whole-body REE in phenotyping studies.

