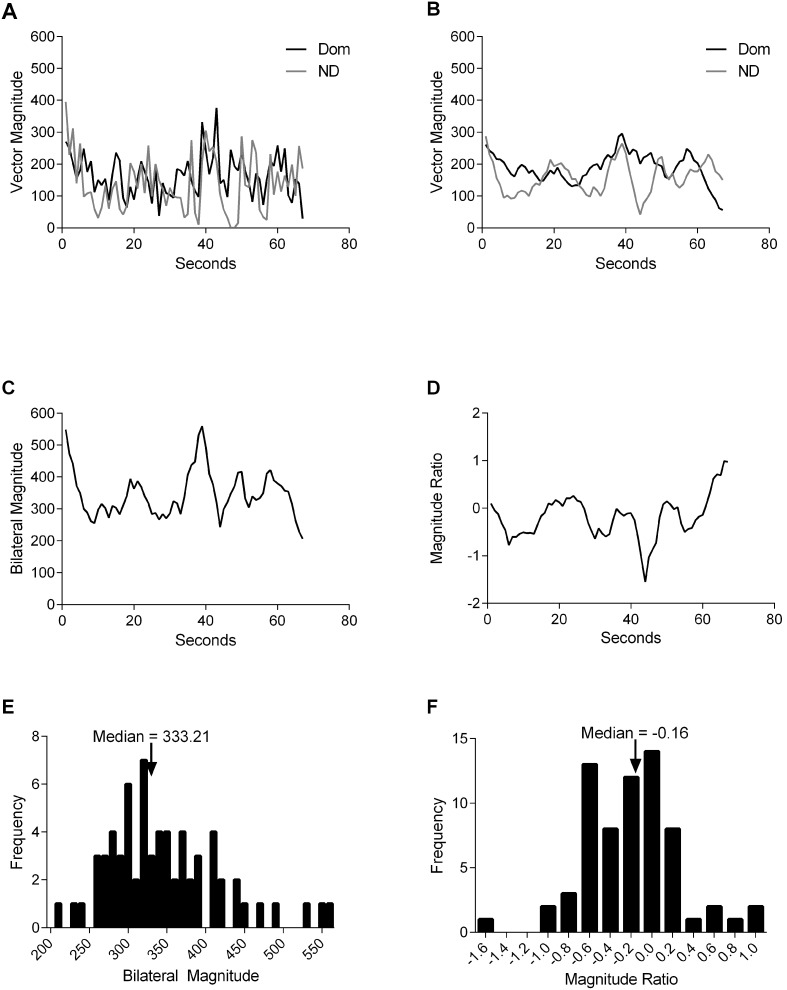
Figure 1. Example of data processing for one participant and one task, Grooming.
A. Vector magnitude (measured in activity counts) for the dominant and nondominant UEs. B. Vector magnitudes were smoothed using a 5-sample moving average, resulting in decreased amplitudes. C. The Bilateral Magnitude (measured in activity counts) was calculated for each second of activity. D. The Magnitude Ratio was calculated for each second of activity. E & F. Histograms of Bilateral Magnitude and Magnitude Ratio values, respectively. The median values are identified by arrows.

