
Figure 1. Expression of NRP2 and SEMA3F in the human thymus and thymocytes.
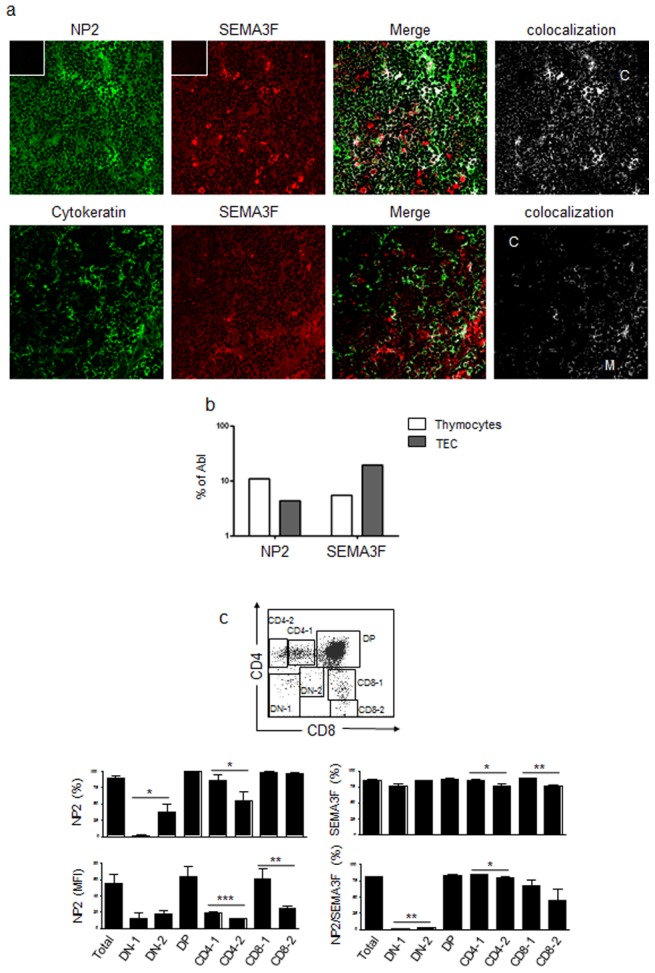
a) Upper panels show the expression of NRP2 and SEMA3F in the human thymus in situ, ascertained by immunofluorescence and confocal microscopy analysis. Lower panels show the expression of SEMA3F and cytokeratin, revealing that SEMA3F is expressed in the epithelial as well as in the non-epithelial compartments of the thymus. Colocalization analysis was performed with ImageJ software. Inserts show negative controls for each secondary antibody. C: cortex; M: medulla. Magnification: 400×. b) NRP2 and SEMA3F mRNA expression analyzed by real time quantitative PCR, compared with the control Abelson (Abl) gene in fresh thymocytes and the THPN thymic epithelial cell line. c) Cytofluorometric dot plot depicts the regions used to separate the CD4/CD8-defined thymocyte subpopulations. Graphs represent the expression of NRP2 and SEMA3F in total thymocytes and each subpopulation. n = 3–6. In the case of NRP2, mean fluorescence intensity (MFI) analyses are shown to illustrate differences in the expression among the thymocyte subpopulations. Data are represented as means ± SEM. Selected thymocyte subsets were analyzed by the unpaired Student's t test and differences were considered statistically significant when p<0.05 (*), p<0.01 (**) or p<0.001 (***). DN-1: CD4−CD8− cells; DN-2: CD4lowCD8low; DP: CD4+CD8+; CD4-1: CD4lowCD8−; CD4-2: CD4highCD8−; CD8-1: CD4−CD8low; CD8-2: CD4−CD8high.