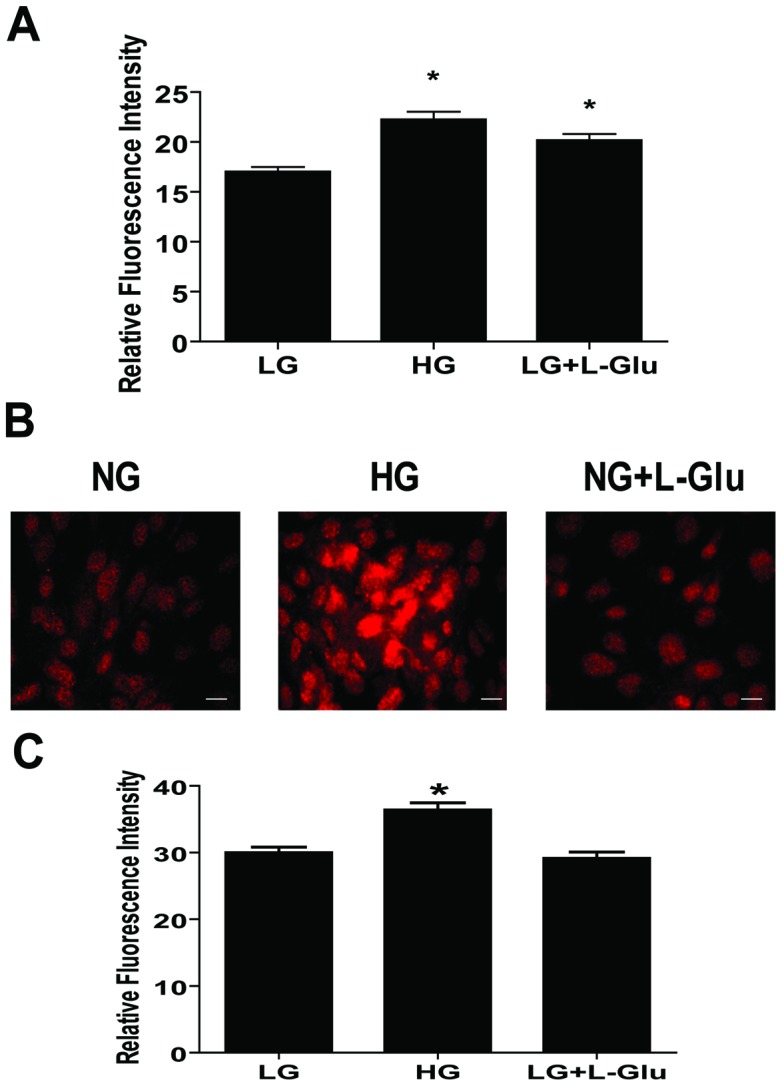
Figure 9. The impact of high glucose conditions on the level of ROS and nuclear localization of Nrf2 in retinal AC.

(A) Retinal AC cultured under high glucose or osmolarity control exhibited a significantly elevated level of ROS compared to normal glucose conditions. Data are presented as mean ± SEM. n≥60; *p<0.05 (NG vs. HG and NG vs. NG+L-Glu). (B) Nuclear localization of Nrf2 in retinal AC under different glucose conditions was examined by immunofluorescence staining. Scale bar indicates 20 µm. (C) Nuclear localization of Nrf2 was assessed by measuring intensity of fluorescence in cell nucleus as described in Methods. Data are presented as mean ± SEM. n≥150 cells; *p<0.05 (NG vs. HG).
