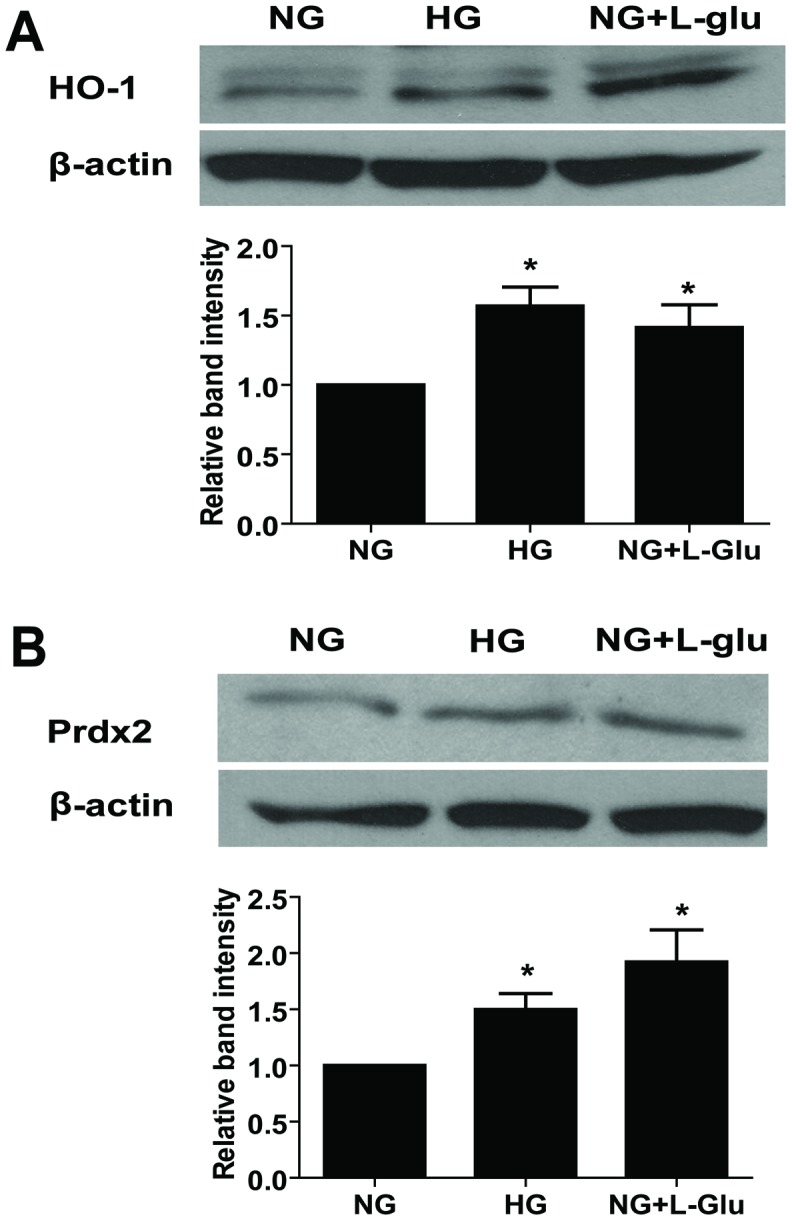
Figure 10. The effect of different glucose conditions on the expression of antioxidant enzymes.

The expression of HO-1 (A) and Prdx2 (B) was determined by Western blot analysis. The quantification of data is also shown. The β-actin was used as loading control. Data are presented as mean ± SEM. n = 3; *p<0.05 (NG vs. HG and NG vs. NG+L-Glu).
