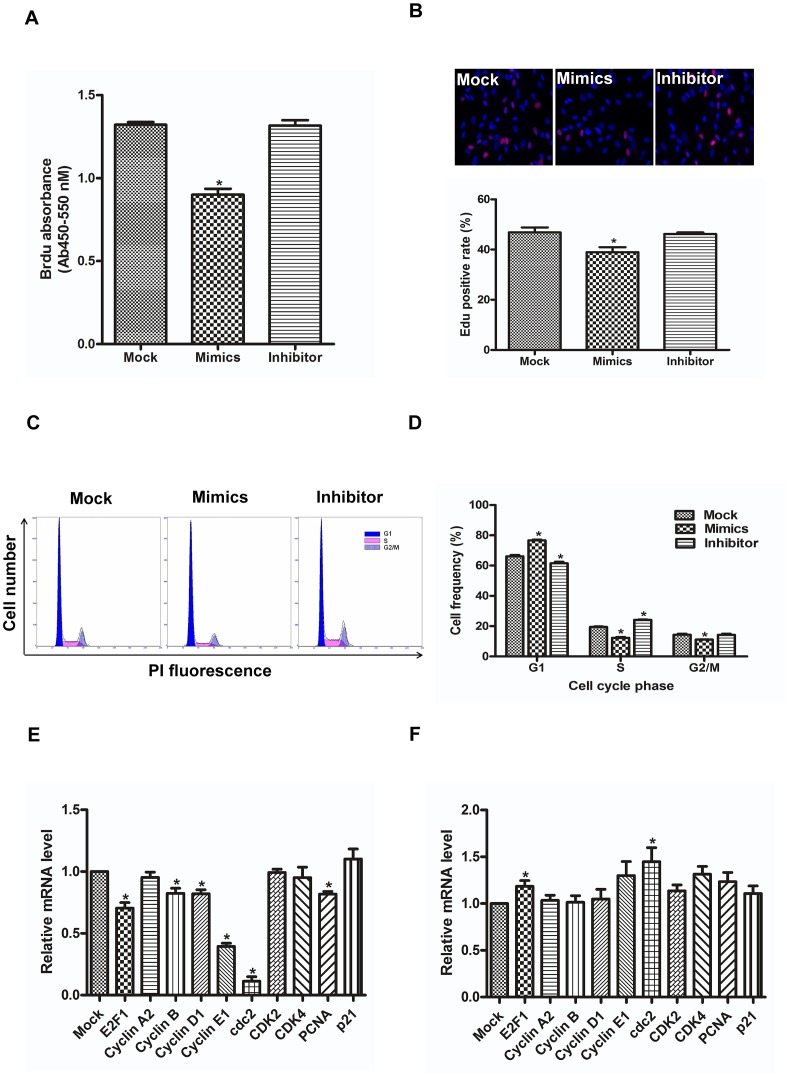
Figure 1. miR-10a reduces proliferation of hCMPCs.
A. miR-10a mimics decrease the BrdU incorporation rate of hCMPCs, whereas a miR-10a inhibitor does not significantly affect the process. *P<0.05, n = 6. B. miR-10a inhibits EdU incorporation of hCMPCs. Representative image of hCMPCs transfected with mock, miR-10a mimics or inhibitor stained with DAPI (blue) and EdU (red) (×200). *P<0.05, n = 5. C. Representative flow cytometry results of hCMPC manipulated with mock, miR-10a mimics or miR-10a inhibitor. hCMPCs overexpressing miR-10a show G1/S blocking, and the inhibition of miR-10a promotes G1/S transition compare with mock. D. Data collected from C. *P<0.05, n = 3. E. Relative expression of cell cycle regulatory genes in hCMPCs transfected with miR-10a mimics. F. The same set of genes was measured in hCMPCs with inhibited miR-10a. The expression level of GAPDH was used as the control. *P<0.05, n = 5.

