
Figure 3.
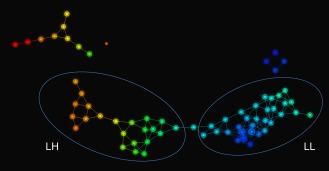
TDA results. An Iris rendering of a Reeb graph of the FXS data, with labels and ellipses added to indicate the subgroups LH and LL. Note that the size of each node corresponds to the number of subjects that were clustered to form that node, and that an edge between two nodes indicates that the corresponding clusters have a subject in common. The light blue node between the subgroups LH and LL is not included in either ellipse because it contains two subjects, one from each subgroup; nevertheless, the edges connected to this node indicate that each of the these subjects is also contained in a neighboring node within the appropriate subgroup. [Color figure can be viewed in the online issue, which is available at http://wileyonlinelibrary.com.]