
Figure 7.
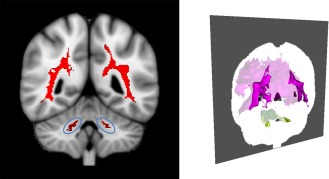
MCP sign and white matter differences. Left: Red color indicates voxels where white matter volume is significantly enlarged in the subgroup LH relative to LL (P < 0.005, corrected), and blue ellipses indicate region spatially analogs to the “MCP sign” in FXTAS. Right: Oblique posterior 3D view with the coronal slice of the left image placed in its correct orientation. Note that opacity of the slice dims the brightness of white matter anterior to the slice, so that the boundary between anterior and posterior white matter coincides with the regions shown in red in the left image. [Color figure can be viewed in the online issue, which is available at http://wileyonlinelibrary.com.]