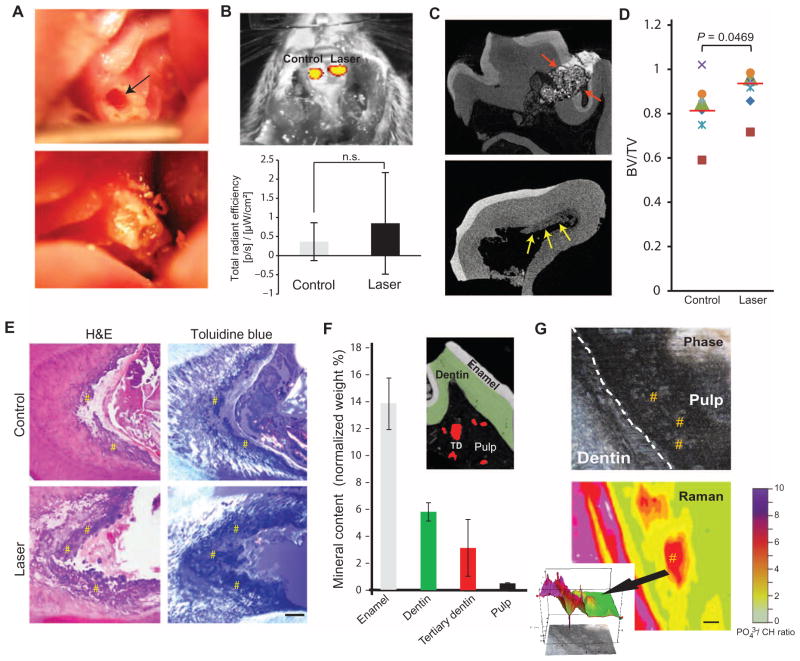
Fig. 1. LPL induces tertiary dentin in a rodent model.
(A) An occlusal defect (arrow, top panel) exposed the pulp in the maxillary first molar in rats. These defects were subsequently irradiated with LPL, packed with microspheres or Ca(OH)2 dressing, and sealed with a restoration (bottom panel). (B) Image and quantification of inflammatory response with a myeloperoxidase probe at 24 hours after pulpal exposure and restoration (Control) versus pulpal exposure followed by LPL treatment (Laser). Data are means ± SD (n = 3). P > 0.05, paired two-tailed t test. (C) Dentin repair imaged by high-resolution μCT. Red arrows in top panel indicate cement filling, and yellow arrows in lower panel indicate tertiary dentin deposition along walls of pulp chamber. (D) Quantification of mineralized tissue formation in defects after 12 weeks using high-resolution μCT imaging after pulp exposure alone (Control) and LPL treatment (Laser). Tissue formation defined by the ratio of bone volume (BV) to total tooth volume (TV). Data are individual animals represented by unique symbols (n = 7). Red lines denote means; P value determined by Wilcoxon matched-pairs signed rank test. (E) Histological analysis of decalcified teeth by hematoxylin and eosin (H&E) and toluidine blue staining, with polarized illumination. Sections were taken from tissue adjacent to the defect. # indicates regions of tertiary dentin. Scale bar, 200 μm. (F) Mineral content of non-decalcified sections by scanning electron microscopy (SEM)–EDS. Data are means ± SD (n ≥ 3). Inset image depicts pseudocolored SEM image of regions assessed for analyses. TD, tertiary dentin. (G) LPL-treated non-decalcified tooth samples (n = 2) were imaged using Raman microscopy to CH. Scale bar, to see compositional map of ratio of phosphate (PO43−) 100 μm. Inset shows quantitative histograph depicting spatial distribution of intrapulpal islands (arrow) of tertiary dentin induction. # indicates regions of tertiary dentin within the pulp.

