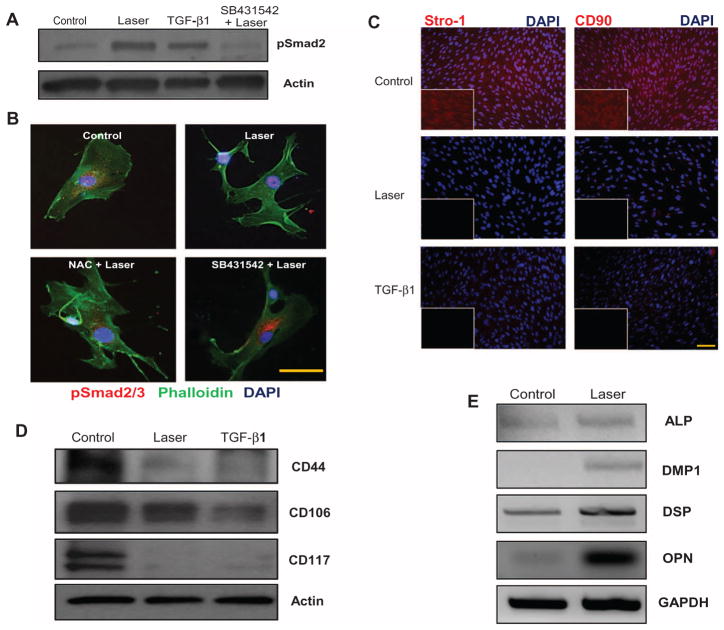
Fig. 4. LPL-induced odontoblastic differentiation of human dental stem cells (hDSCs).
(A) Phospho-Smad2 expression in hDSCs after LPL treatment. TGF-β1 treatment served as a positive control. Some cells were pretreated with TGF-βRI inhibitor, SB431542, before LPL treatment. Actin served as a loading control. (B) The TGF-β responsiveness of hDSCs was assessed by nuclear translocation of p-Smad2/3 after LPL treatment. Counterstaining for cytoskeletal actin (phalloidin) and nuclei [4′,6-diamidino-2-phenylindole (DAPI)] was performed. Tricolor overlays are shown. Some samples were preincubated with NAC or SB431542 before LPL treatments. Scale bar, 20 μm. (C) Immunofluorescent labeling of stem cell markers Stro-1 and CD90 in hDSCs 7 days after LPL or TGF-β1 treatment. Controls are untreated hDSCs. Nuclei were counterstained with DAPI. Inset shows red channel only. Scale bar, 50 μm. (D) Western blots for stem cell markers CD44, CD106, and CD117 in hDSCs 7 days after LPL or TGF-β1 treatment. Actin served as a loading control. (E) Dentin matrix expression was assessed by semiquantitative reverse transcription polymerase chain reaction (RT-PCR) in hDSCs, 7 days after LPL treatment. Gel images were inverted (black bands) for clarity of presentation.

