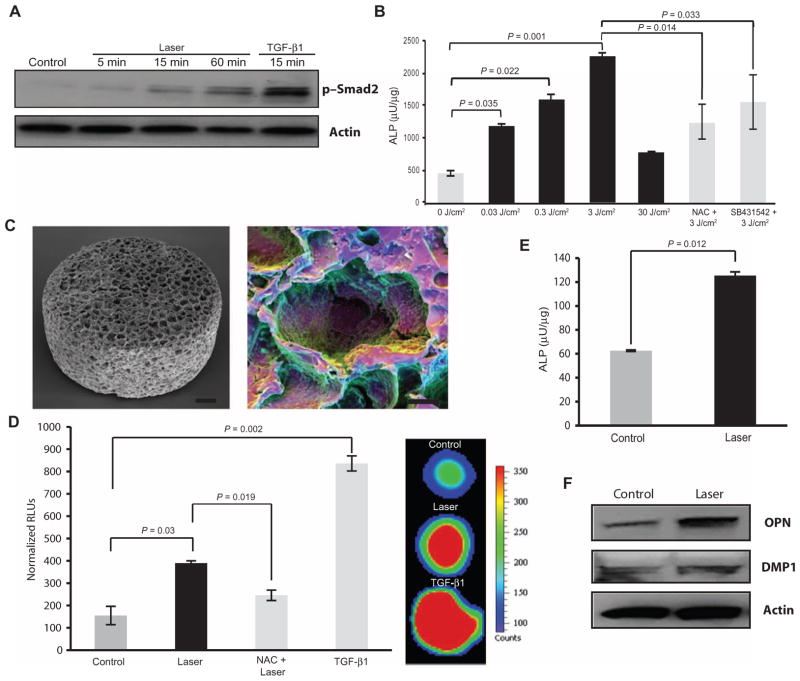
Fig. 5. LPL directs dentin differentiation in 2D and 3D mouse pre-odontoblast cultures.
(A) The kinetics of TGF-β1 responsiveness of MDPC-23 after LPL or TGF-β1 treatment was assessed with phospho-Smad2 Western blot. (B) ALP activity 3 days after LPL treatment of mouse MDPC-23 cells. Some cells were preincubated with NAC or SB431542 before LPL treatments. (C) SEM image of PLG macroporous scaffolds used for 3D culture (left). Polychromatic SEM technique shows cells seeded within scaffold pores (right). Scale bars, 100 μm (left) and 50 μm (right). (D) Left panel shows quantification of luciferase activity from TGF-β reporter (p3TP luc) Mv1Lu cells at 24 hours after LPL or TGF-β1 treatment. Some scaffolds were preincubated with NAC before LPL treatment. Panel on the right shows hypercolored image of in situ luciferase imaging of reporter cells within 3D scaffolds. (E) LPL induction of mineralizing phenotype assessed by ALP activity in mouse odontoblast-like cells (MDPC-23) cultured in 3D scaffold cultures at 21 days. (F) Western blots for DMP1 and OPN after LPL treatment of MDPC-23 cells cultured in 3D PLG scaffolds for 21 days. In (B), (D), and (E), data are means ± SD (n = 3). P values determined by two-tailed t test.

