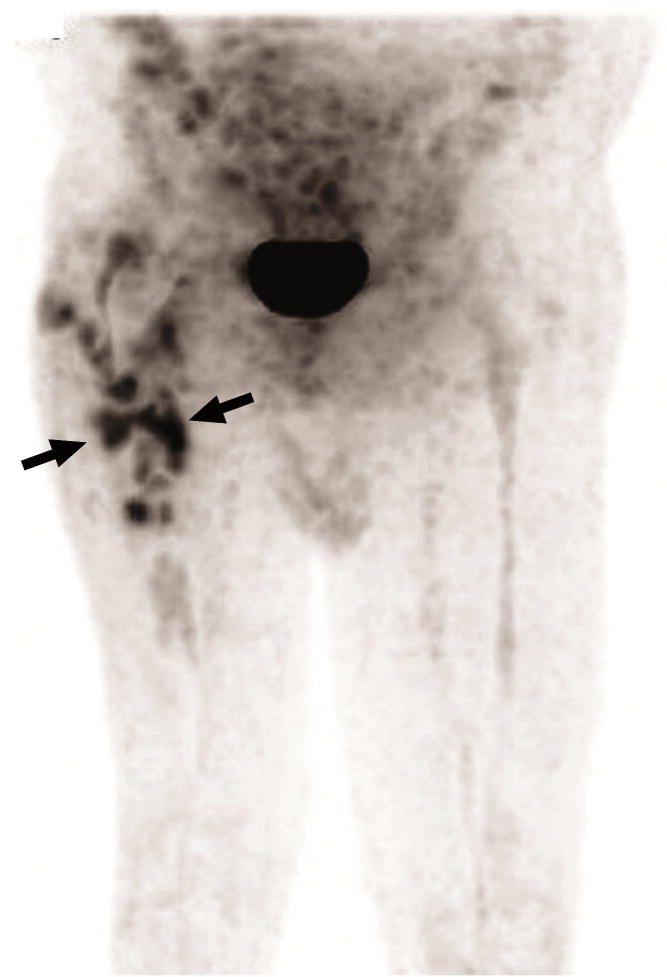
Figure 2.
This maximum intensity projection image shows significant uptake of FDG in an irregular pattern in the upper half of the right femur, which were demonstrated to be located at the bone-prosthesis interface on the tomographic images. Again, this is a typical pattern for infected hip prosthesis.

