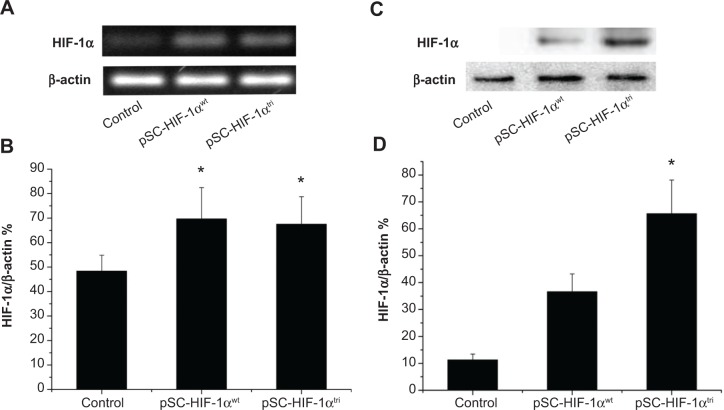
Figure 4.
Stability of wild type and mutant HIF-1α mRNA and protein in C2C12 cells.
Notes: Cells were transfected with 0.9% saline (Control), pSC-HIF1αwt and pSC-HIF1αtri respectively, and harvested 3 days later for semi-quantitative RT-PCR and Western blot analysis. (A) Representative image of RT-PCR products showing HIF-1α mRNA levels. (B) Band intensity of the RT-PCR products was quantified using the Image Lab™ Software (Bio-Rad, Hercules, CA, USA). HIF-1α mRNA levels were presented as the relative values compared with β-actin expression in the same sample (n=3). *P<0.05 versus the control. (C) Representative image of Western blot showing HIF-1α protein levels. (D) Band intensity in the Western blot assay was quantified using the Image Lab™ Software (Bio-Rad). HIF-1α protein levels were presented as the relative values compared with β-actin expression in the same sample (n=3). *P<0.05 versus all other groups.
Abbreviations: HIF-1αwt, wild-type hypoxia-inducible factor 1-alpha; HIF-1αtri, hypoxia-inducible factor 1-alpha triple mutant; mRNA, messenger RNA; RT-PCR, reverse transcription polymerase chain reaction; SC, cytomegalovirus promoter/SV40 enhancer; SV40E, SV40 enhancer.

