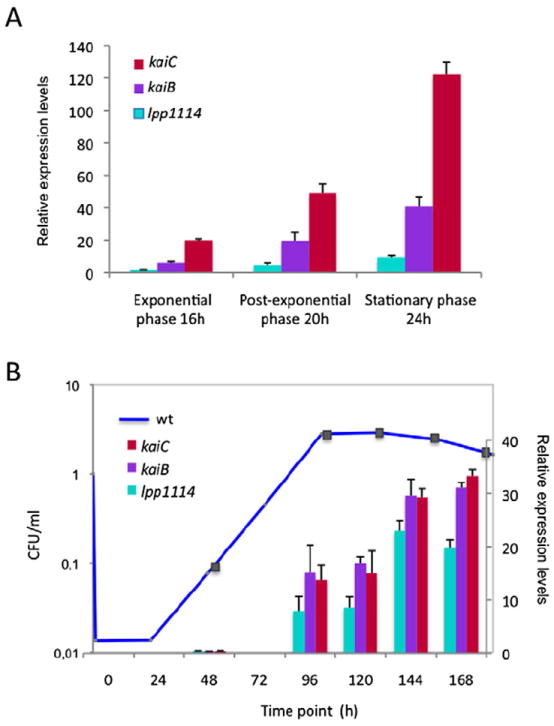
Fig. 2.

The expression of the kai operon genes is growth phase dependent in vitro and in vivo in Acanthamoeba castellanii.
A. Quantitative real-time polymerase chain reaction of the kai operon genes during 24 h in vitro growth. The bars represent the relative quantity of mRNA at the sampled time points relative to mRNA levels at exponential phase (OD 2.5). Red bars kaiC; purple bars, kaiB; cyan lpp1114.
B. Relative gene expression of the kai operon genes during intracellular growth in A. castellanii. Amoebae were infected with Legionella pneumophila wild type at MOI = 100 and the infections were followed at 20°C over 7 days (168 h). The squares on the growth curve indicate the time points (hours) of intracellular growth when the mRNA samples were taken. Transcription levels of the genes were calculated with respect to the values obtained at 72 h. The bars represent the mean of two independent experiments ± standard deviation.
