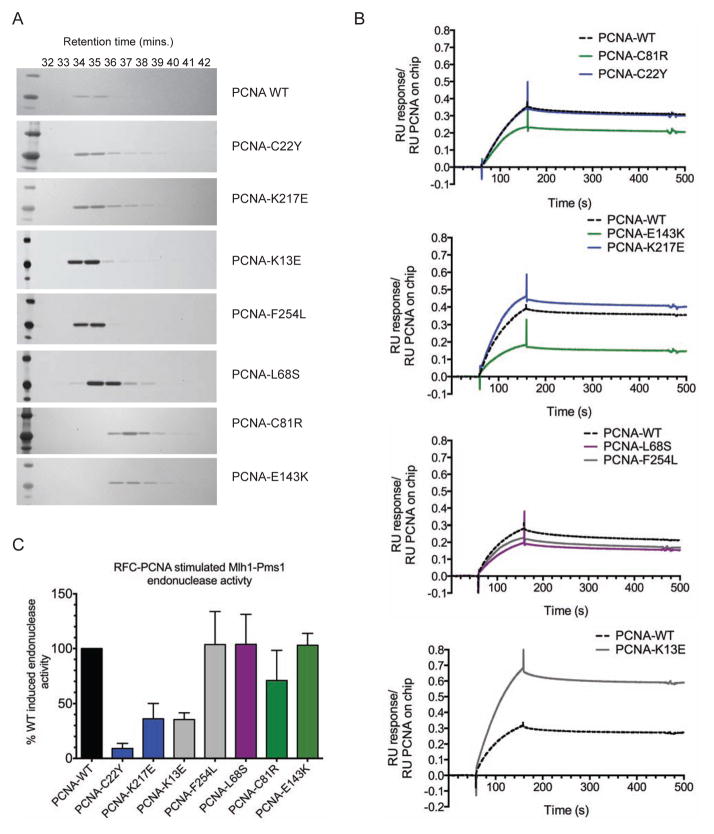
Figure 2. Biochemical characterization of PCNA mutant proteins.
(A) Purified mutant PCNA proteins were chromatographed on a size exclusion column and analyzed by SDS-PAGE. (B) Msh2-Msh6 binding to wild-type or mutant PCNA was analysed by SPR. PCNA was bound to the chip and RU was monitored over a 100 s injection of 100 nM Msh2-Msh6 followed by 300 s of buffer flow. Data is normalized to the amount of biotinylated PCNA in each channel and the sensorgrams from representative experiments are shown. Mutants are shown in relation to the wild-type control performed on each chip (dotted black line) and colored according to their grouping on the PCNA crystal structure (blue- C22Y-cluster, green- trimer interface, purple- IDCL-adjacent, grey- ungrouped). Also see Figure S3. (C) Activation of the Mlh1-Pms1 endonuclease by wild-type and mutant PCNA. Purified Mlh1-Pms1 was incubated with RFC and either wild-type or mutant PCNA along with supercoiled circular DNA. The percentage of the nicked product produced relative to that produced by Mlh1-Pms1, RFC and wild-type PCNA was determined. The value presented is the average (+/− standard deviation) from replicate experiments.

