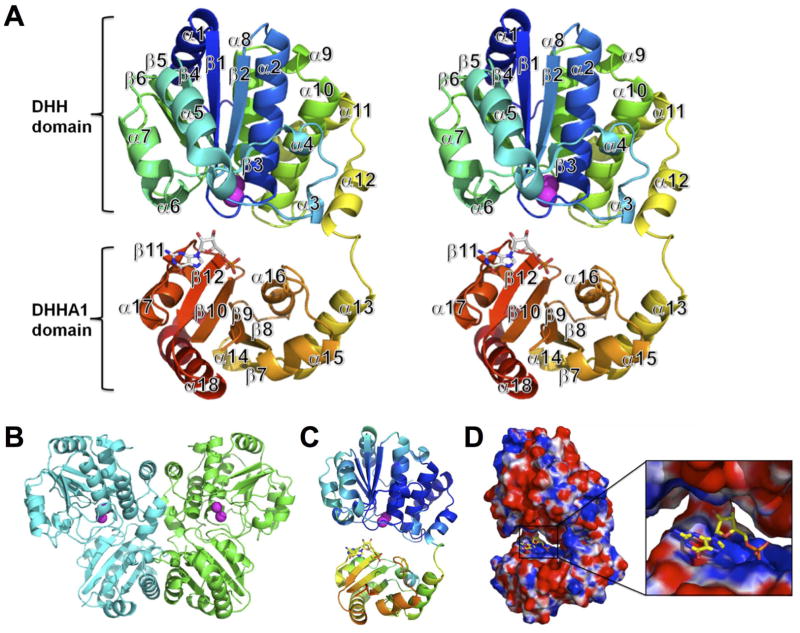
Fig. 1.
Crystal structure of the bfNrn-Mn2+-GMP complex. (A) Stereo-view of the cartoon representation. The chain is color ramped from blue (N terminus) to red (C terminus). Mn2+ ions are shown as spheres. GMP is represented by a stick model. (B) A homodimer in the crystal by crystallographic 2-fold axis. (C) Distribution of the B-factor of main chain atoms. The B-factor is colored from high (red) to low (blue). (D) Electrostatic potential surface (positive potential, blue; negative potential, red). The GMP-binding site is expanded (inset).

