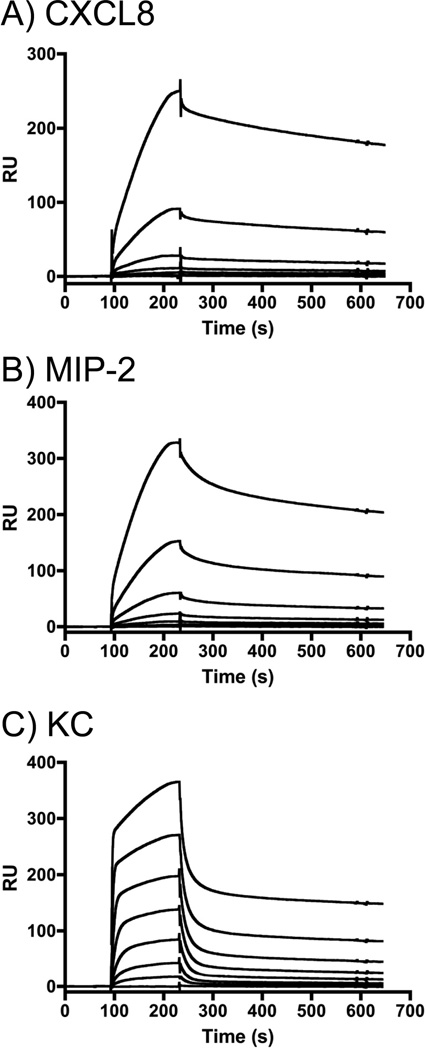
Figure 6.
Sensorgrams obtained used SPR reveal the chemokines bind heparin with different kinetics. The binding of various concentrations of rhCXCL8 (A), MIP-2 (B), and KC (C) to heparinized CM-4 chips is shown. (A) The concentration of rhCXCL8 was (upper to lower curves) 1000 nM, 500 nM, 250 nM, 125 nM, 62.5 nM and 0 nM. (B) The concentrations of MIP-2 were (upper to lower curves) 1000, 333, 111, 37, 12.4, 4.12, nM, (C) The concentrations of KC were (upper to lower curves) 1000, 333, 111, 37, 12.4, 4.12, 1.37, 0.46, 0.15 nM.

