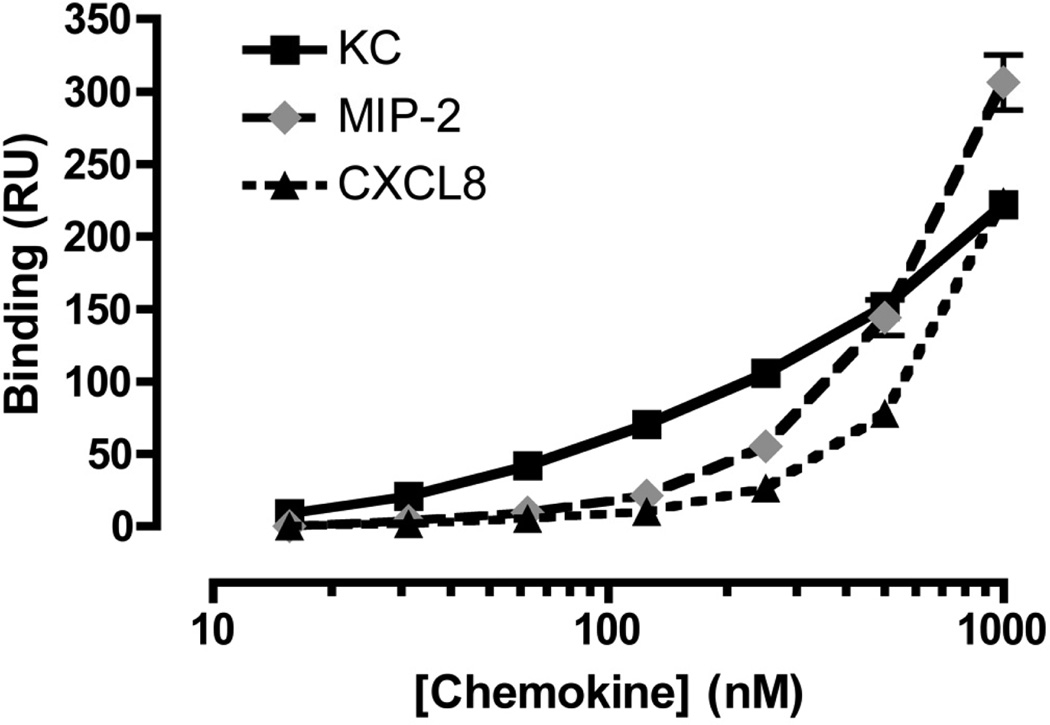
Figure 7.
Dose response curves reveal differences in the binding behavior of the chemokines. The binding of KC (▪, full line), MIP-2 (◆, grey dashed line) and CXCL8 (▲, dotted line) to heparin immobilized on a CM-4 sensor chip is shown. Means and standard errors of the mean are shown, calculated from 3 independent experiments.

