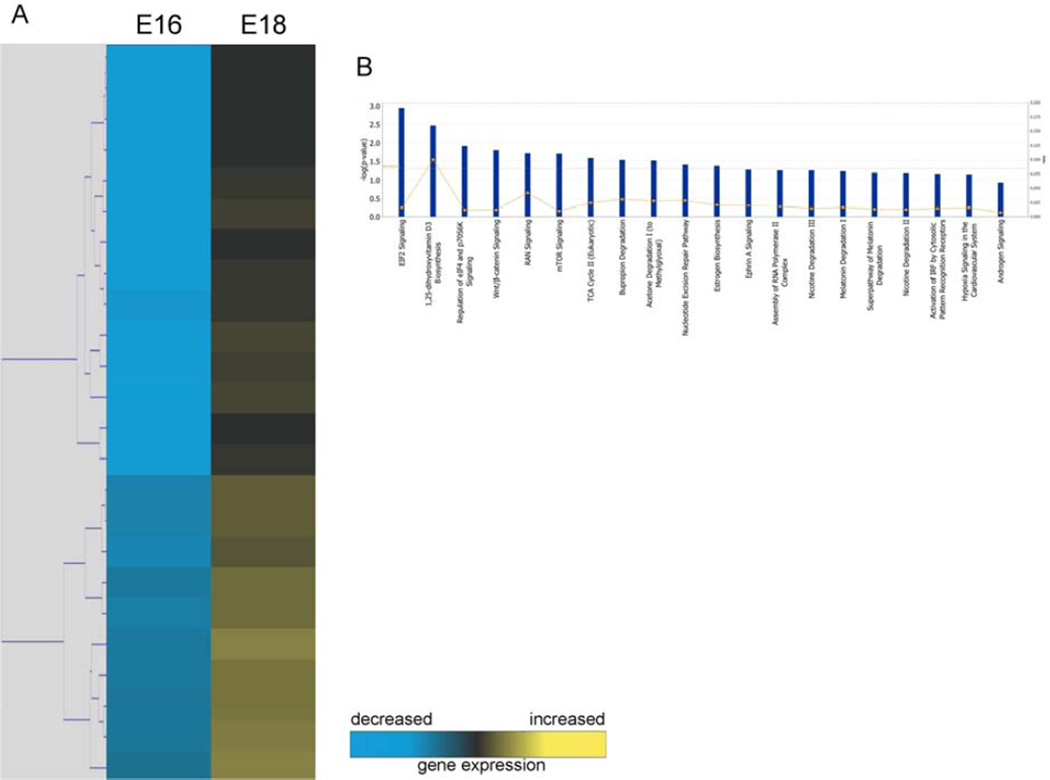
Figure 1. Microarray analysis of E16 and E18 keratinocytes.
(A) Hierarchical clustering of differentially regulated genes from fetal keratinocytes at E16 vs. E18. Individual genes are clustering according to the dendrogram on the left, and expression levels are represented in the heatmap on the right. Yellow and blue indicate up- and down-regulation, respectively. (B) Canonical pathways significantly enriched for among genes whose expression was significantly downregulated in E16 samples compared to E18.

