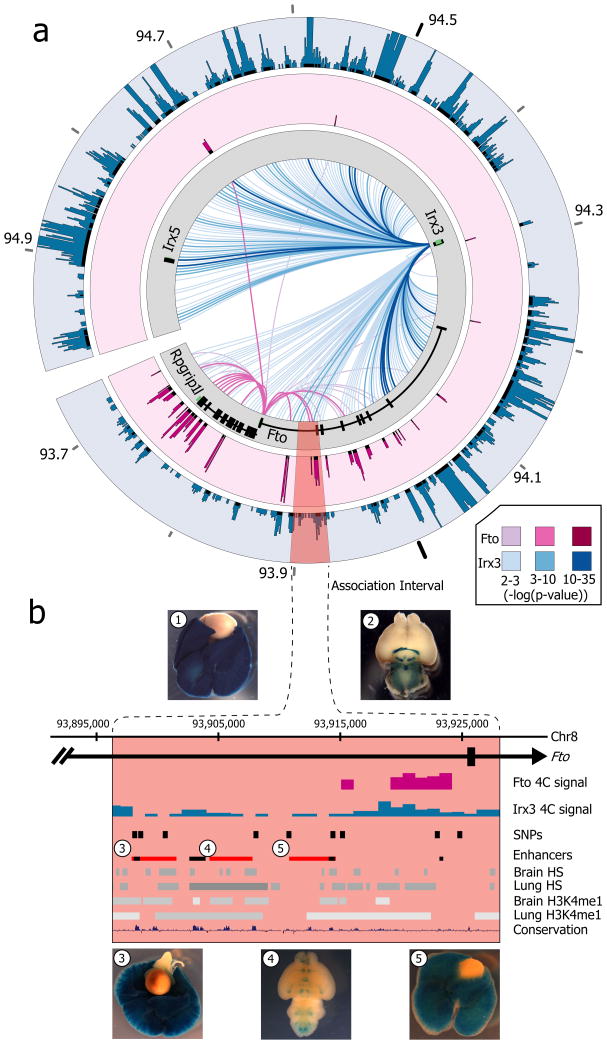
Figure 1. Long-range interactions in the IRX3/FTO locus.
a, Mouse embryo 4C-seq interactions emanating from each promoter are displayed as links across the circle (darker link implies greater significance). Outer plots show significance of interactions above background (-log(p-value)). The obesity-associated interval is highlighted red. b, Magnified view of the association interval. Contained within are the orthologous locations of obesity-associated SNPs (black pips), and epigenetic marks associated with regulatory elements. Endogenous Irx3 expression is shown (1. lung, 2. brain) in Irx3lacZ knockin mouse. Three enhancers (rectangles 3–5) drive reporter expression in lungs (3, 5) and brain (4). Other enhancers17 are shown in black.

