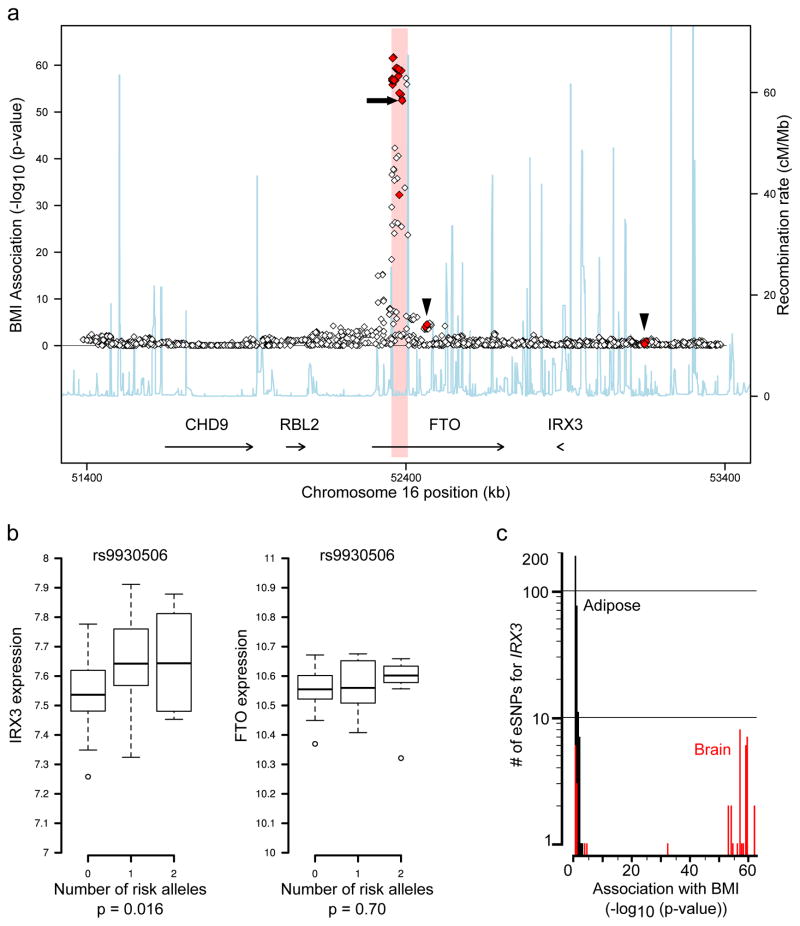
Figure 2. BMI-associated SNPs are eSNPs for IRX3, not FTO, expression in human brain.
a, SNPs associated with BMI in the FTO locus. 43 SNPs associated with IRX3 expression (eSNPs) are shown in red, including 11 also associated with BMI. No SNPs are associated with FTO expression (p-value>0.05). Arrowheads: IRX3 eSNPs outside the obesity-associated region (pink); arrow: rs9930506. b, In cerebellum, the allele of rs9930506 associated with increased BMI (risk allele) is correlated with increased IRX3 expression and not with FTO expression. c, Histogram plotting the number of SNPs associated with IRX3 expression in adipose (black) and brain (red) (y-axis) by the significance of their association with BMI (x-axis). Full statistical details in Methods.

