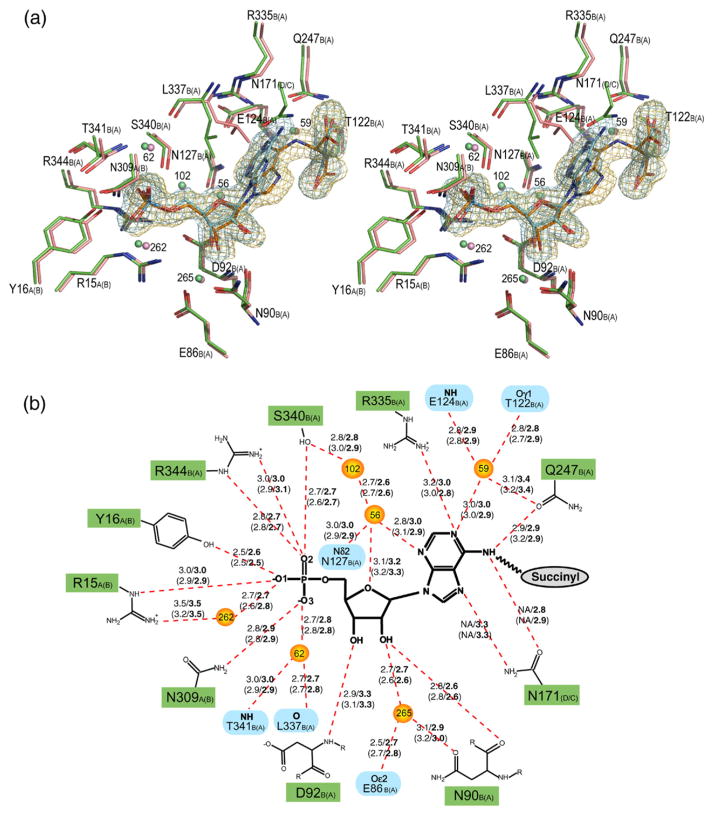
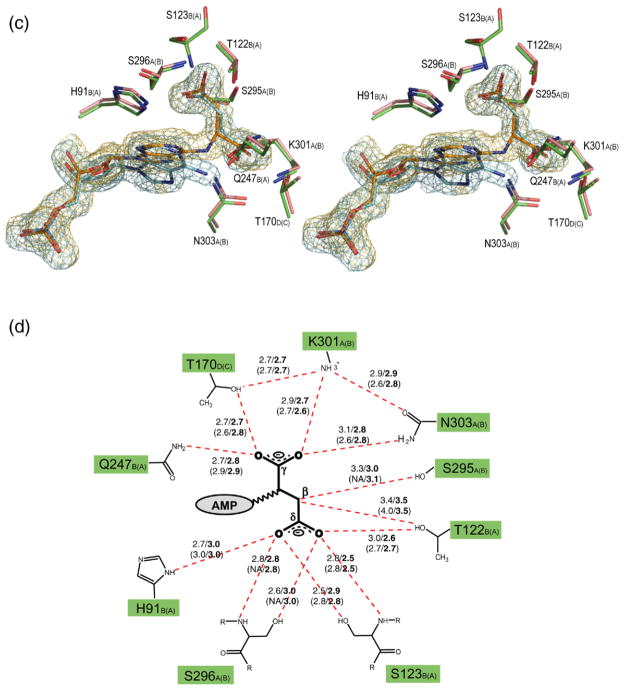
Figure 2.
Stereo view of the superimposed H171A (pink) and H171N (green) active sites, showing the interactions involving the AMP (a) and fumarate groups (c). The σA weighted Fo–Fc omit maps for the substrate (orange) and products (blue) in the H171A and H171N proteins, respectively, are shown contoured at 3σ. Water molecules are shown as spheres. The corresponding schematic representations for the AMP and fumarate groups are shown in (b) and (d), respectively. Hydrogen bonds are represented as red broken lines with the distances indicated in angstroms (Å). Distances for the H171N protein are in bold, and the distances for active site 2 of each protein are given in parentheses. The letter following the residue number denotes the monomer to which each residue belongs, with those for active site 2 of the proteins shown in parentheses. In (b), residues involved in coordinating water molecules are colored blue. Poor electron density did not allow residues S295 and S296 in active site 2 of the H171A protein to be modeled. PyMol was used for Figure preparation.


