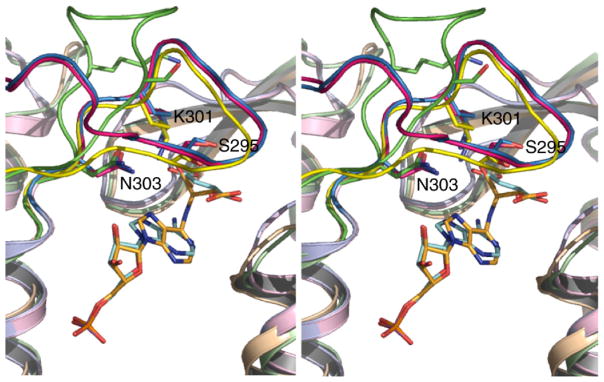
Figure 3.

Stereo view of the superimposed H171A–ADS (pink), H171N–AMP•FUM (blue) and (yellow) active sites, showing the conformation of the C3 loop in the proteins. Since the C3 loop in the SeMet protein could not be modeled due to the absence of electron density, the open conformation of the loop observed in the dδc2-S281A mutant12 is also shown for comparison (green). The side-chains of selected C3 loop residues are shown and numbered according to the E. coli ADL sequence. PyMol was used for Figure preparation.
