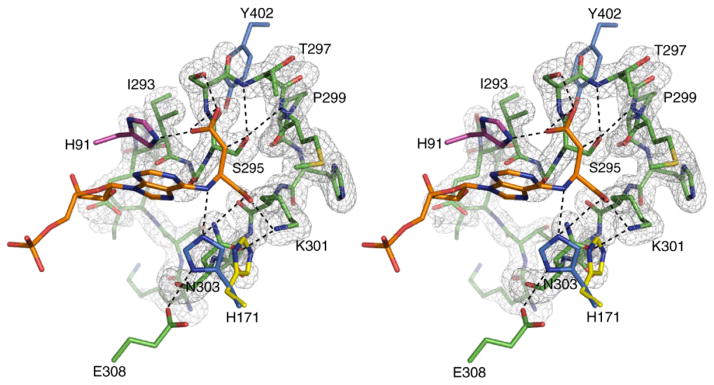
Figure 4.

Stereo view of the σA weighted Fo–Fc omit map of residues 287–303 of the H171A–ADS protein, contoured at 3.0σ. Additional residues within 5 Å of S295 are shown. Also illustrated is the conformation of H171 as observed in the SeMet wild-type protein (yellow), and when modeled to reflect the conformation of N171 in the H171N–AMP•FUM complex (blue). Residues contributed by monomers A, B, and D are colored green, pink, and blue, respectively. Hydrogen bonds are represented by broken lines. PyMol was used for Figure preparation.
