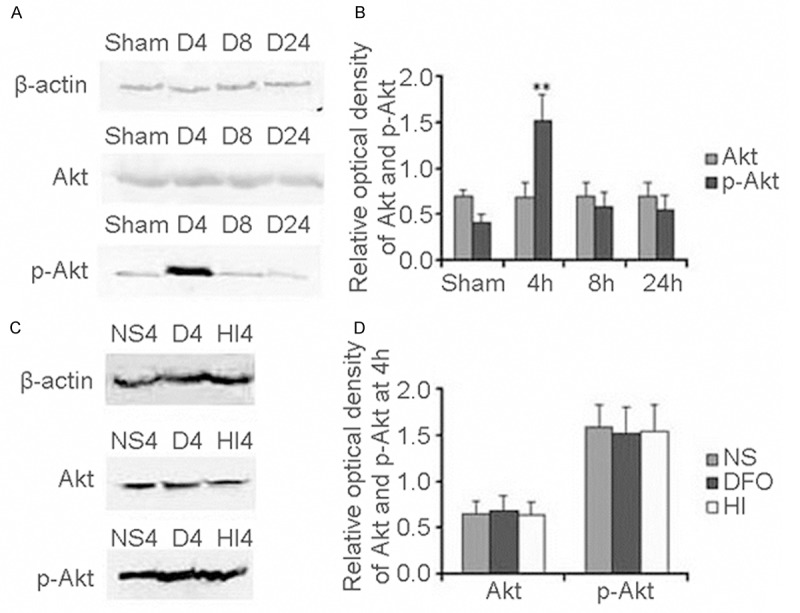
Figure 2.

PI3K/Akt levels after HI in P10 rat brains. Western blot quantitative analysis of Akt and p-Akt expression in DFO treated group (A). Quantification of Akt and p-Akt protein expression in different times and sham control. Data were obtained by densitometry and were normalized using β-actin as the loading control. Values are expressed in relative optical density and represented as mean ± SD. For each column, n=4. *p<0.05, **p<0.01 compared with the sham control (B). Western blot quantitative analysis Akt and p-Akt expression in different group (HI group, DFO treated group and NS treated group) (C). Quantification of Akt and p-Akt protein expression in different groups (HI group, DFO treated group and NS treated group). Data were obtained by densitometry and were normalized using β-actin as the loading control. Values are expressed in relative optical density and represented as mean ± SD. For each column, n=4. *p<0.05, **p<0.01 compared with the HI group and NS treated group (D). (HI, hypoxia-ischemia; D, DFO treated group; NS, 0.9% NaCl treated group).
