
Figure 6.
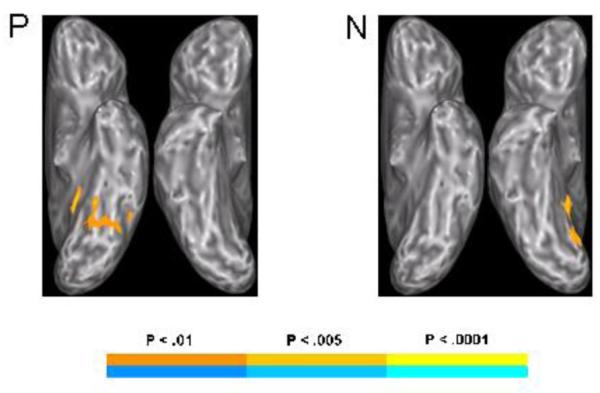
Regions significantly correlated with the Categorical Perception Index in the full sample for the phonemic (P) and nonphonemic (N) conditions. The maps were thresholded at a voxelwise z > 2.577 with clusters smaller than 891 μl removed, yielding a mapwise threshold of alpha < 0.05.