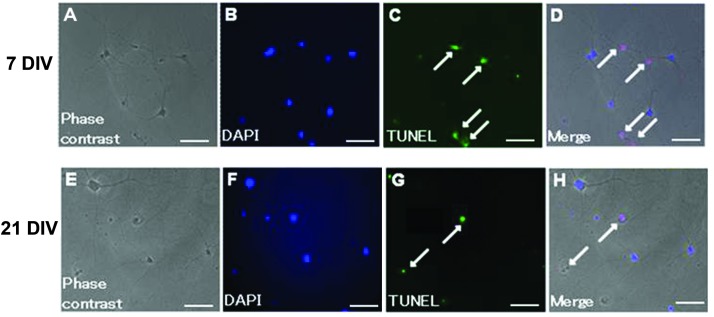
Figure 2.
TUNEL analysis of cells undergoing radiation-induced apoptosis. (A–D) 7 DIV neurons; (E–H) 21 DIV neurons. (A and E) Phase contrast images; (B and F) DAPI fluorescence images; (C and G) TUNEL fluorescence images; (D and H) double fluorescence images for TUNEL (red) and DAPI (blue). Scale bar = 50 μm. DIV, days in vitro; TUNEL, terminal deoxynucleotidyl transferase-mediated dUTP nick end labeling. Magnification, ×20. The arrows indicate nuclear pylnosis.

