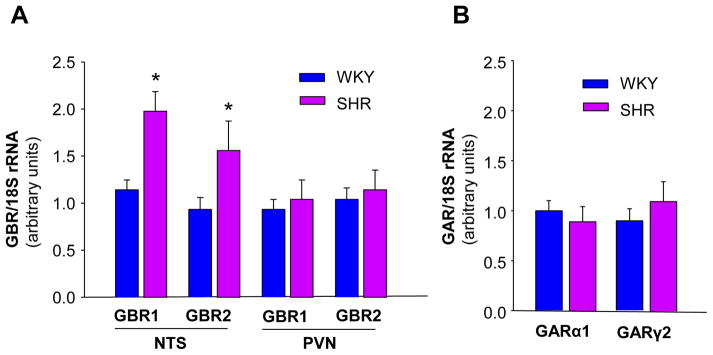
Figure 1.

GAR and GBR mRNA levels in the NTS of SHR and WKY rats. A: GBR mRNA levels in the NTS and the PVN of SHR and WKY rats. GBR mRNA levels were detected with real-time RT-PCR as described in Methods. Data were normalized with 18S rRNA and represent means ± SE of the fold increase over WKY GBR1 (n=3 rats in each group). *P<0.05 vs. WKY rats. B: GAR mRNA levels in the NTS of SHR and WKY rats. Data were normalized with 18S rRNA and represent means ± SE of the fold increase over WKY GARα1 (n=3 rats in each group).
