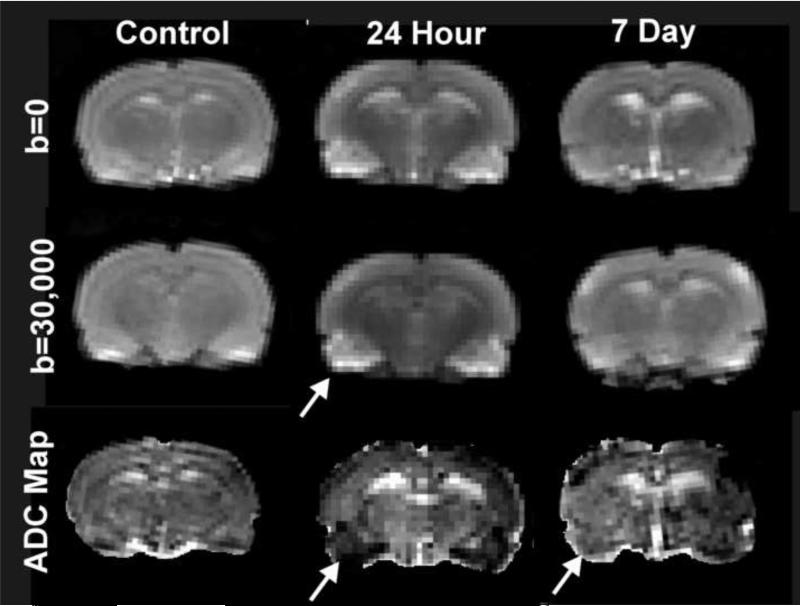
Figure 1.
Diffusion weighted imaging (DWI) maps spatial and temporal evolution of injury following pilocarpine induced seizures. The piriform cortex and amygdala reveal increased signal intensities at 12 and 24hr post status epilepticus that then returns to control levels by 7 days. Apparent diffusion coefficient maps (ADC) were generated from unweighted (b = 0, predominately T2) and weighted (b= 30000 s/cm2) images. Note the increased signal intensity in the piriform cortex (arrows) and their corresponding hypointensities are seen on the ADC maps. In addition, pseudo-normalization of the ADC occurs within the piriform cortex (arrow) at 7 days post status epilepticus. (Data acquired on a 1.5T clinical scanner with a surface coil)

