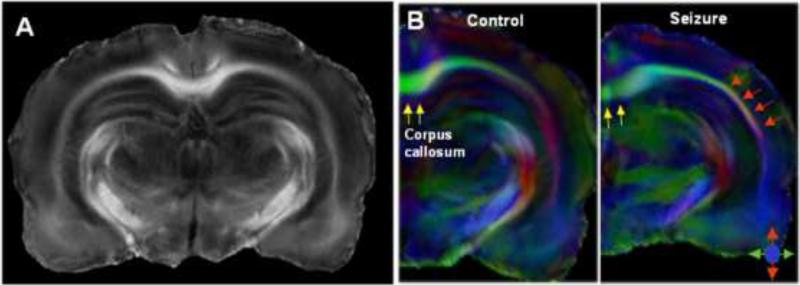
Figure 2.
Diffusion tensor imaging 30 days after febrile seizures reveals altered white matter structures. A) Relative anisotropy maps can be used to visualize and extract quantative data from a multitude of anatomical regions. B) Pseudo-colored relative anisotropy images illustrate the alterations within the corpus callosum of a rat following febrile seizures (yellow and red arrows). Other tissue level alterations are also observable (i.e. thalamus). (Data were acquired at 11.7T using a volumetric coil).

