
Figure 2. Effect of 20-HETE on apoptosis of cultured neonatal rat ventricular myocytes.
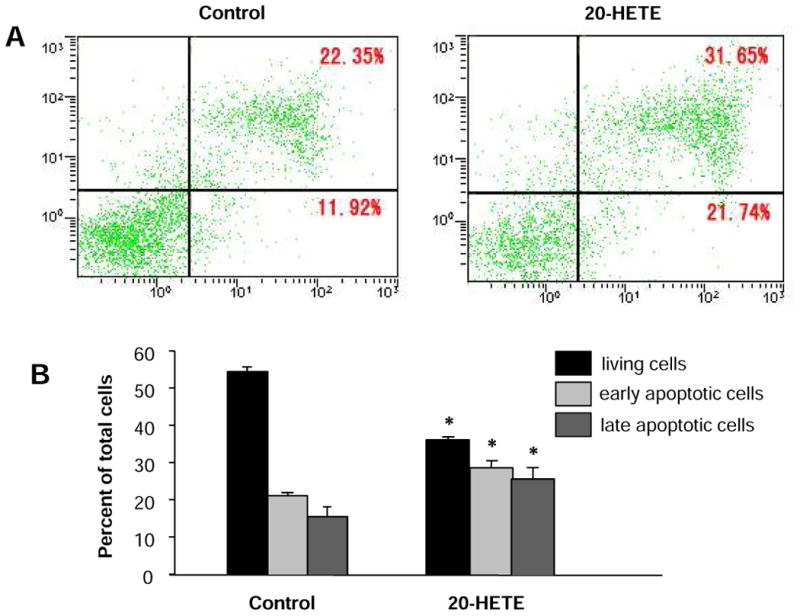
The cell apoptosis was measured by flow cytometry following anexin V and propidium iodide (PI) double staining in cardiomyocytes treated with vehicle control or 20-HETE(10 nM) for 24 h. A. Examples of dot-plots of cells treated with control and 20-HETE. Horizontal axis represents annexin V intensity and vertical axis shows PI staining. The lines divide each plot into four quadrants: lower left quadrant, living cells; lower right quadrant, early apoptotic cells; upper left quadrant, necrotic cells; upper right quadrant, late apoptotic cells. B. Bar graphs summarizing the mean percentage of living cells, ratio of cells in early and late apoptosis as represented in A. Data are expressed as mean±SE obtained from three experiments using independent batches of cells in each group. *P<0.05 significant difference compared to control.