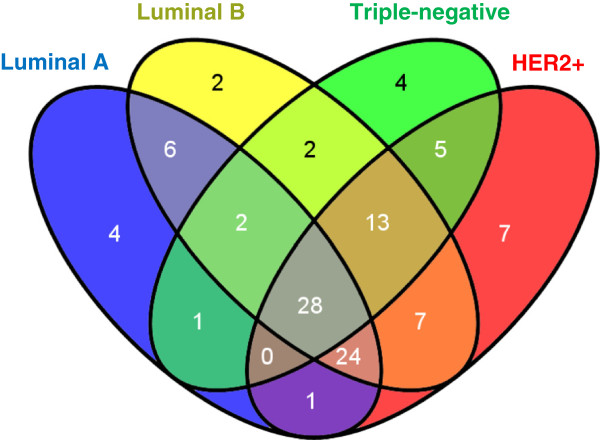
Figure 3.

The Venn diagram of pathway enrichment analysis results from the RNA-Seq data. There are 15 regions in the Venn diagram including common enriched pathways and subtype-specific pathways. Common enriched pathways are pathways enriched in all four subtypes of breast cancer. Subtype specific pathways are pathways enriched in only one subtype of breast cancer.
