
Figure 4.
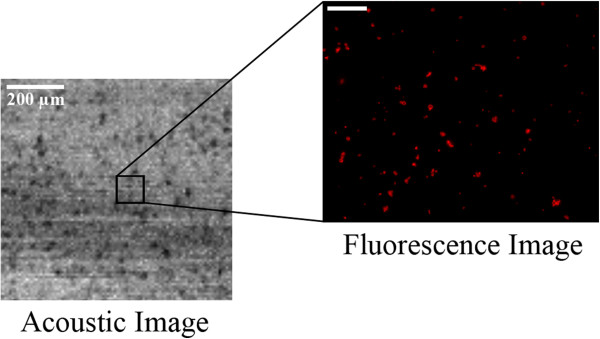
Ultrasound and optical/fluorescent images of biofilm matrix. A 1 × 1 mm area of the biofilm sample was scanned at a center frequency of 100 MHz with a time-resolved high-frequency scanning acoustic microscope. Inset shows a smaller region of the same sample imaged by fluorescence microscopy. Due to the fact that the acoustic lens is mounted onto a piezoelectric scanner, it provides greater flexibility in imaging larger regions than a microscope objective alone, which is limited by its stationary positioning.