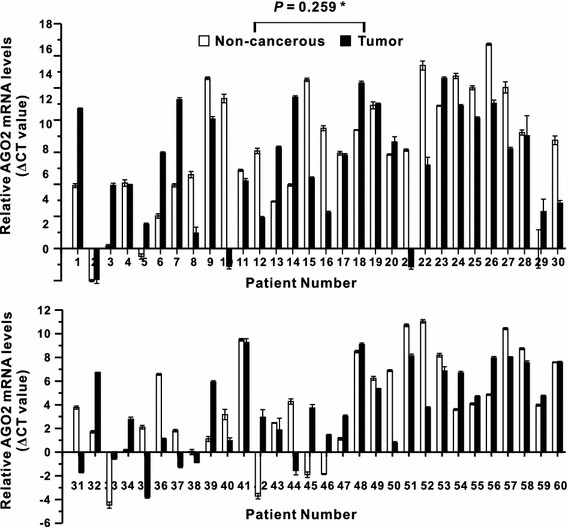
Fig. 2.

The relative AGO2 mRNA level (normalized to the corresponding β-actin mRNAs) in tumor tissues compared to adjacent non-cancerous colorectal tissues. Asterisk indicates Wilcoxon signed-rank Test

The relative AGO2 mRNA level (normalized to the corresponding β-actin mRNAs) in tumor tissues compared to adjacent non-cancerous colorectal tissues. Asterisk indicates Wilcoxon signed-rank Test