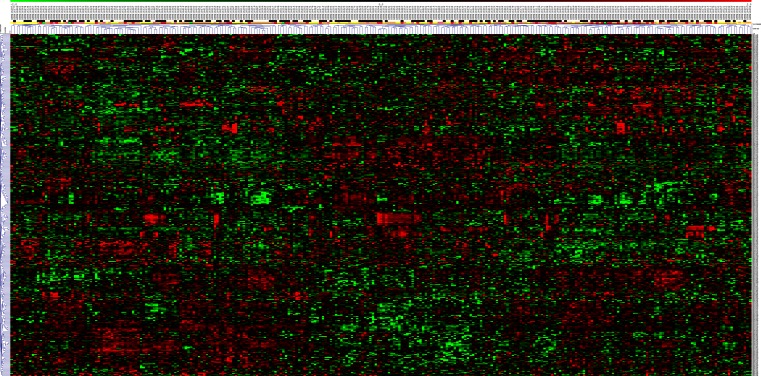
Fig. 6.
Hierarchical clustering of 281 prostate cancer tissues. Gene expression values of the genes encoding potential prostate cancer biomarkers in 281 prostate cancers from dataset GSE16560 were clustered using Euclidean distance measure and average linkage. Cancer status (indolent = white, lethal = black) and Gleason score (5 = green, 6 = yellow, 7 = orange, 8 = pink, 9 = red) are indicated in the bars above the dendrogram

