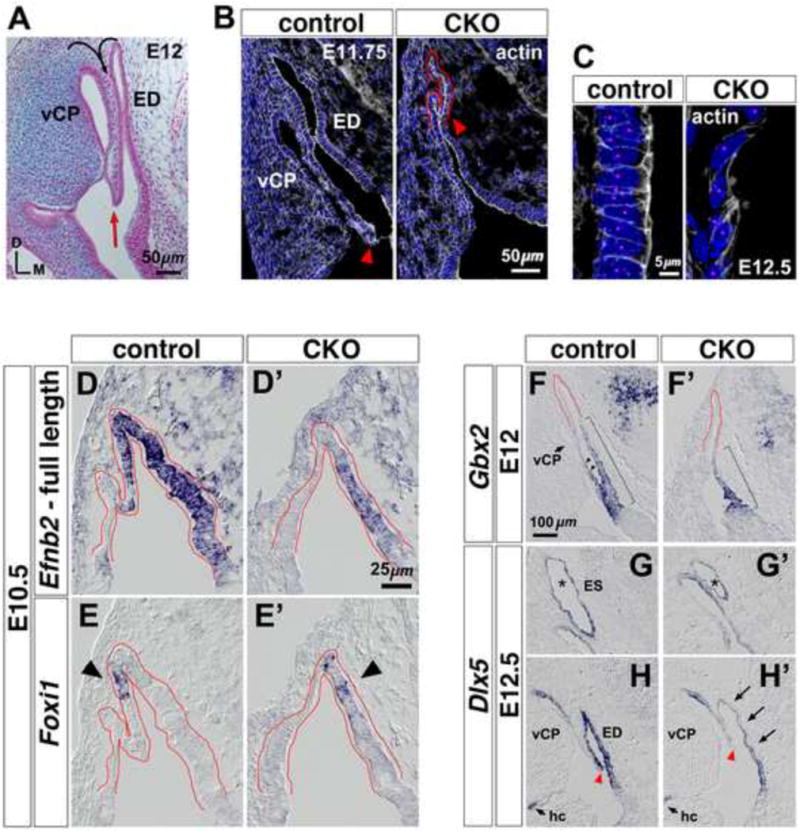
Figure 5. Altered morphogenesis and gene expression at the Efnb2 CKO dorsal otic epithelium.

(A) Histology of E12 dorsal otic epithelium in the transverse plane. Curved arrows indicate prior-stage folding and invagination to form the ED and vertical canal plate (vCP). Red arrow highlights ventral edge of invagination. Axes apply to all photos. (B) Sections from an E11.75 Efnb2flox/+-CKO littermate pair, labeled with phalloidin and DAPI. Arrowheads highlight ventral extent of invagination. (C) High power views of proximal segments from the lateral ED wall of an E12.5 Efnb2flox/+-CKO littermate pair. Magenta dots indicate individual nuclei. (D-E′) Efnb2flox/+-CKO littermate pair hybridized to detect Foxi1 or full-length Efnb2. The recombined Efnb2 floxed allele produces non-translated transcript, allowing domains of Efnb2 transcription to be identified in the null mutant (D′). Dorsal otocyst epithelium is outlined in red. Arrowheads in (E,E′) highlight the location of initial Foxi1 mRNA signal. (F-H′) RNA-hybridized sections from Efnb2flox/+-CKO littermate pairs, shown to scale. Brackets in (F,F′) highlight proximal-distal extent of Gbx2 signal. Arrowheads (F) highlight Gbx2 signal at the ED lateral wall. Asterisks in (G,G′) highlight the ES. Arrows in (H′) highlight attenuated Dlx5 mRNA signal. Arrowheads in (H,H′) highlight ventral extent of invagination; fields in (H,H′) are aligned relative to the horizontal crista (hc). vCP, vertical canal plate.
