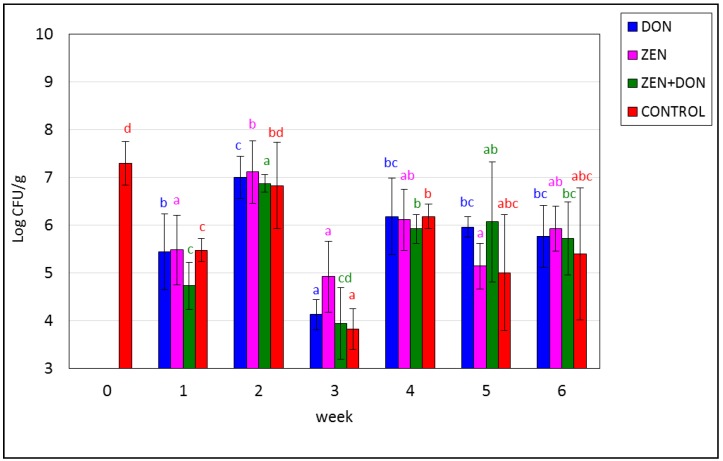
Figure 4.
Mycotoxin-induced changes in the amounts of Clostridium perfringens in the ascending colon. The values plotted in the charts represent means from three samples in each week ± SD. Results significantly different from control in each week (p < 0.05) are marked by black asterisks. The different color letters for average values in each group indicate statistically significant differences in the concentration of particular microorganisms within the time of sampling (p < 0.05).

