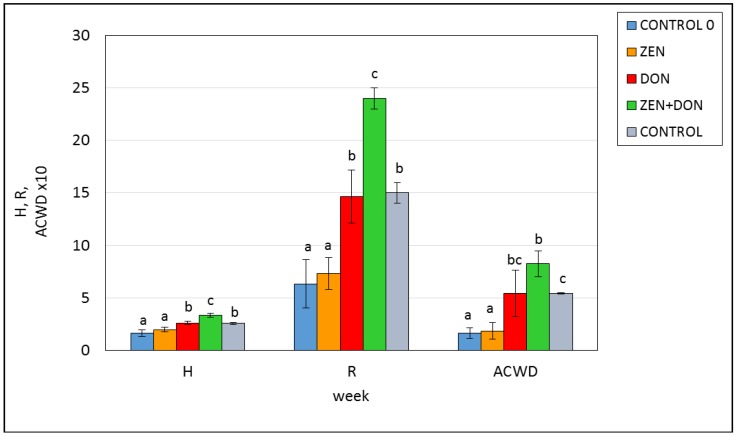
Figure 5.
The influence of mycotoxins on the functional diversity of the microbiota in the ascending colon. H—Shannon’s index; AWCD—average well color development; R—richness index; CONTROL 0—control sample before exposition; ZEN, DON, ZEN+DON; CONTROL—samples after six weeks of exposition by ZEN, DON, ZEN+DON, and placebo, respectively; the different letters for average values indicate statistically significant differences in the H, R, or ACWD value within the group (p < 0.05).

