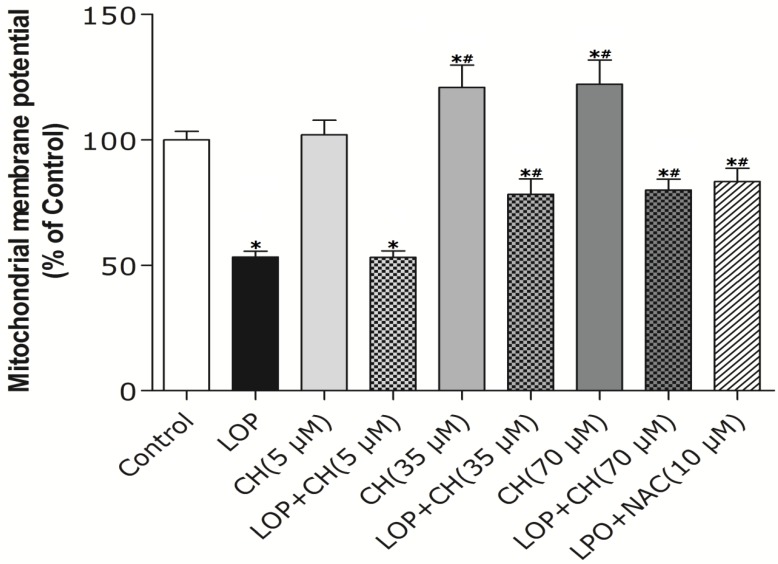
Figure 3.
The effects of LOP and choline on Δψm. C3A cells were cultured in MEME with or without LOP, choline (5, 35, 70 μM) and NAC (10 mM) treatment for 72 h. Δψm was measured by fluorescence analysis using Rhodaminel23 as a fluorescent cationic dye through a spectrofluorometer. CH, choline; LOP, lactate (10 mM), octanoate (2 mM) and pyruvate (1 mM). Values represent the mean ± SD of three independent experiments performed in duplicate. * p < 0.05 vs. control. # p < 0.05 vs. LOP.

