
Figure 4.
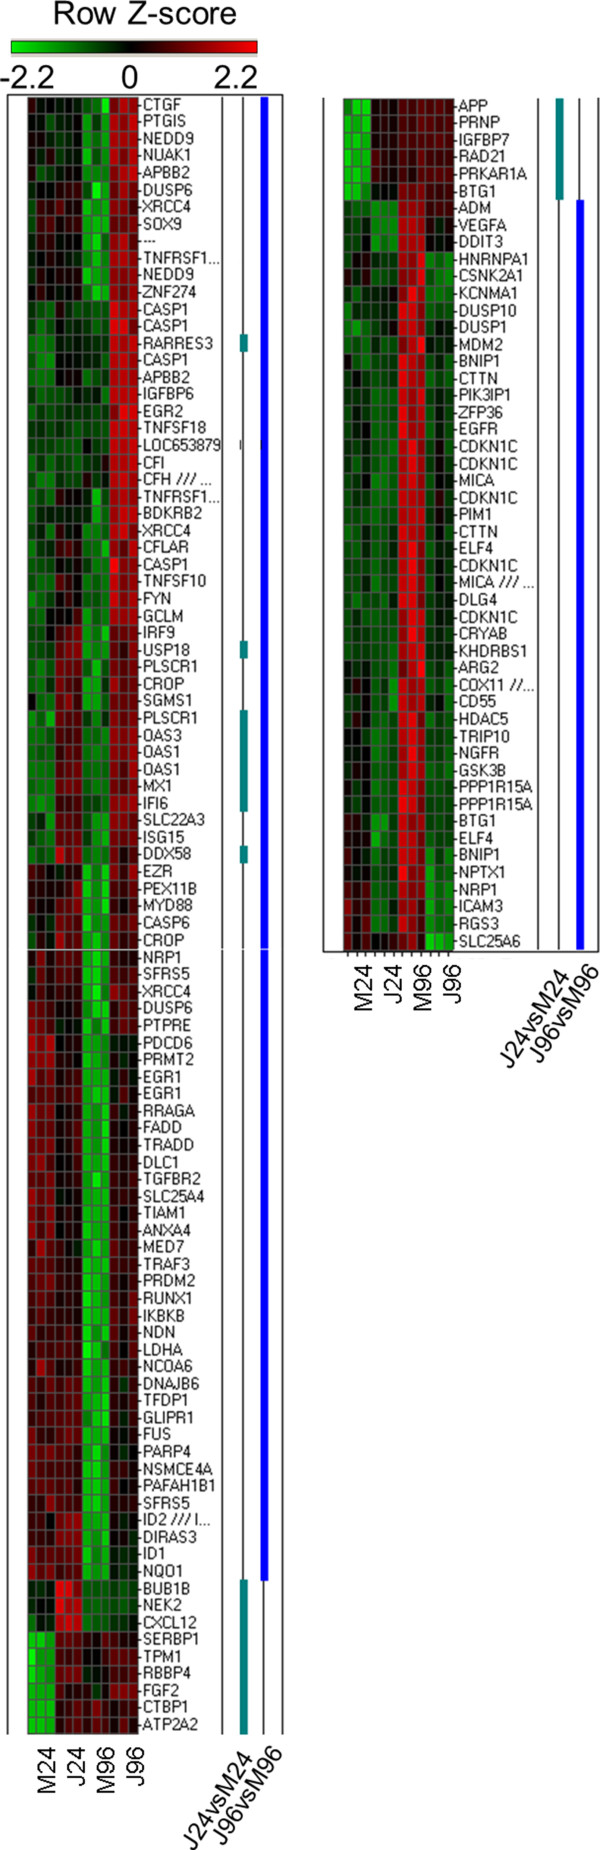
Differential expression profile of transcripts categorized as regulators of cell death of NHA infected with JUNV. Heat map plot of differentially expressed cell death associated transcripts for 24 and 96 h p.i. Rows are arranged by hierarchical clustering following Z-score transformation of the normalized data. Columns represent mock-infected (M24 and M96) and JUNV-infected (J24 and J96) tissue culture triplicates at 24 and 96 h p.i., respectively. Blue and green notches represent differentially expressed cell death associated transcripts for 24 and 96 h p.i. respectively.