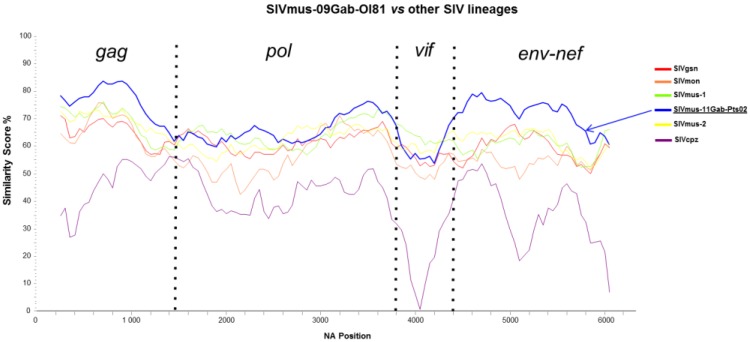
Figure 4.
Similarity plots of nucleotide sequences illustrating the extent of genetic diversity between the new SIVmus and other SIV lineages. Similarity plots of gag, pol, vif, env, and nef non-concatenated nucleic acid sequences showing similarities between SIVmus-09Gab-0I81 and SIVmus-11Gab-Pts02 and other SIVs representative for the different SIV lineages (sliding window of 500 na moved in steps of 50 na). Only SIV lineages of interest are retained in the figure for clarity.

