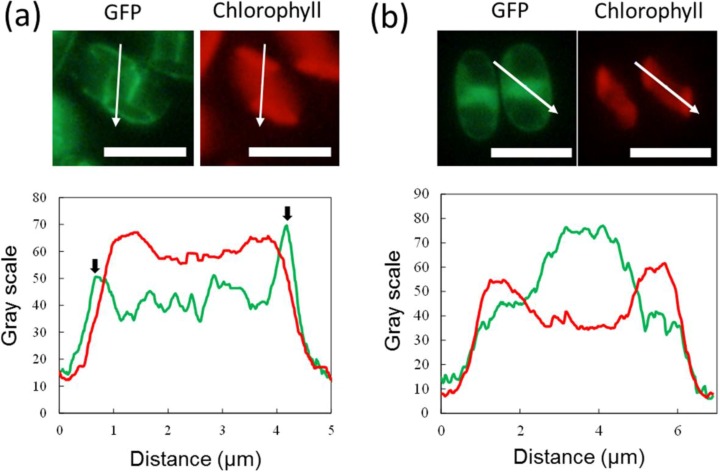
Figure 3.
Fluorescence profiling on the microscopic images of F. solaris JPCC DA0580 expressing SDOAP1-GFP (a) and neat GFP (b). Fluorescent signals of GFP and chlorophyll along the white arrows in the images are shown in green and red lines, respectively. Fluorescent peaks of GFP outside of the chlorophyll fluorescent region are shown with the black arrows. (scale bar = 5 μm).

