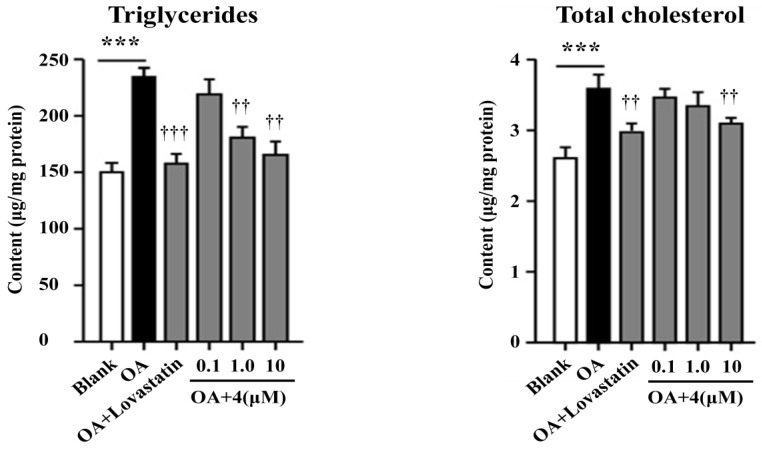
Figure 7.
Inhibitory effects of 4 toward triglycerides and total cholesterol. Intracellular levels of triglycerides and total cholesterol were measured by kits according to the manufacturer’s instructions. Bars depict the means ± SEM of at least three experiments. *** p < 0.001, OA vs. Blank; †† p < 0.01, ††† p < 0.001, test group vs. OA group. OA: oleic acid.

