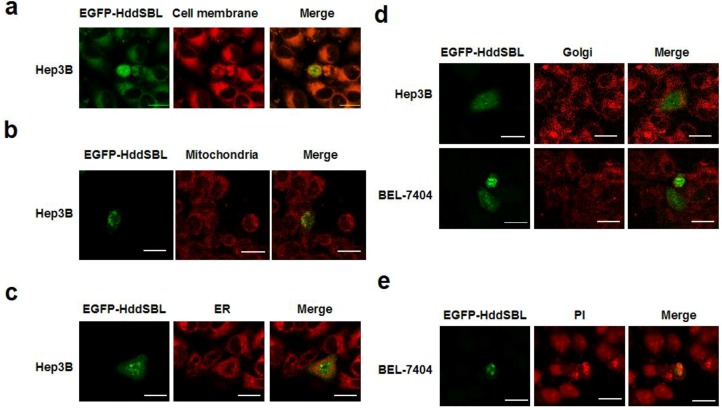
Figure 3.
Subcellular distribution of HddSBL. Hep3B or BEL-7404 cells were transfected with pEGFP-HddSBL-C1. Cells were then stained with DiI (a); Mito Tracker Red Mitochondrion-Selective Probe (b); Golgi-Tracker Red (c); ER-Tracker Red (d); and PI (e); followed by analysis under a confocal laser scanning microscope. Bars show 20 μm. The diagrams are representative of at least four repeats.

