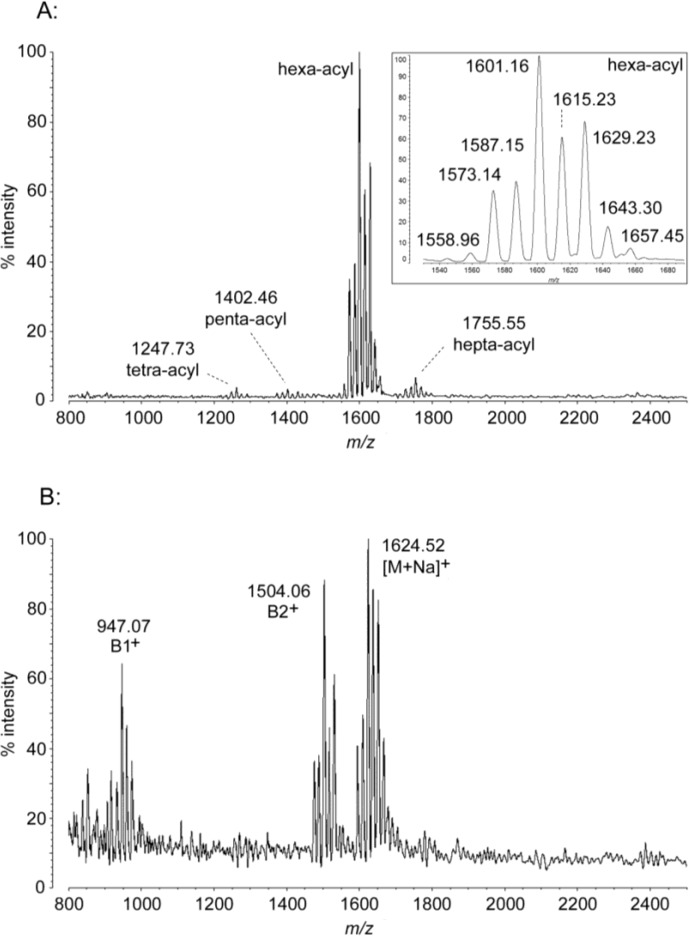
Figure 4.
MALDI-TOF mass spectra of P. cryohalolentis lipid A. Purified lipid A was prepared by mixing with ATT matrix as described in Materials and Methods. Spectral data were collected by Shimadzu Axima Confidence MS with a power setting of 65 and pulsed extraction at 2000 Da as the average of 2000 profiles in the linear negative mode (A) or in the linear positive mode (B). Peak interpretation is shown on the spectra and in Table 1.

