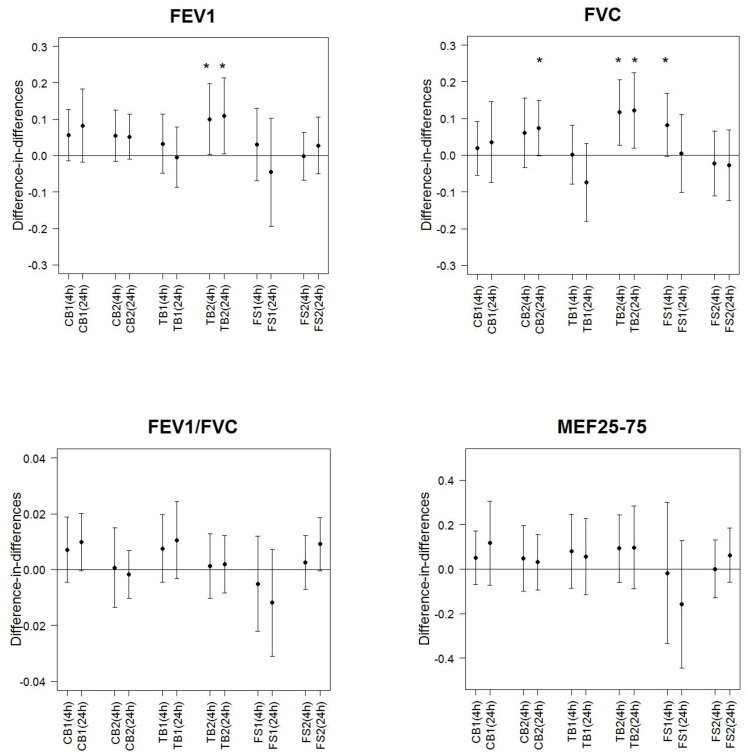
Figure 1.
Difference-in-differences of lung function variables (FEV1 (L), FVC (L), FEV1/FVC (%), MEF25%–75% (L/s)) at 4 h and 24 h after exposure computed for different indoor sources and exposure levels contrasting to RA.
Notes: *: p-value < 0.05 from Wilcoxon signed rank test. RA: room air, CB: candles burning, TB: toasting bread, FS: frying sausages, 1: level 1, 2: level 2, (4 h) (24 h): 4 h and 24 h after exposure.

