Abstract
Understanding why spectra that are physically the same appear different in different contexts (color contrast), whereas spectra that are physically different appear similar (color constancy) presents a major challenge in vision research. Here, we show that the responses of biologically inspired neural networks evolved on the basis of accumulated experience with spectral stimuli automatically generate contrast and constancy. The results imply that these phenomena are signatures of a strategy that biological vision uses to circumvent the inverse optics problem as it pertains to light spectra, and that double-opponent neurons in early-level vision evolve to serve this purpose. This strategy provides a way of understanding the peculiar relationship between the objective world and subjective color experience, as well as rationalizing the relevant visual circuitry without invoking feature detection or image representation.
Keywords: empirical ranking, color vision, perception, simple networks, receptive field
The spectral properties of retinal images conflate illumination, surface reflectance, atmospheric transmittance, and a host of other factors. Nonetheless, biological visual systems routinely generate lightness and color percepts that lead to successful behavior in the real world. Thus, a major question in vision research is how the visual system contends with the fact that the physical parameters of the world are not available in retinal stimuli (the “inverse optics problem”).
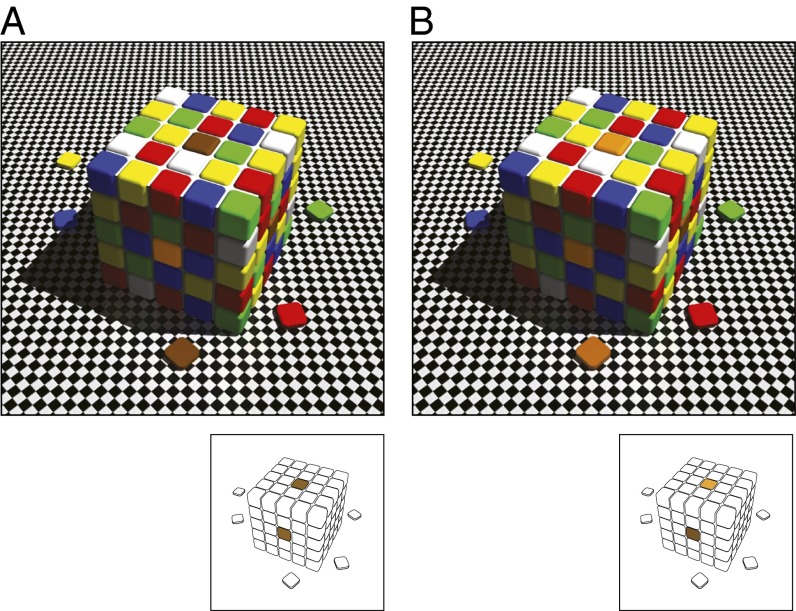
A clue to the possible answer is the phenomenology of lightness and color perception. As shown in Fig. 1, the same contextual information can make regions of an image returning identical spectra to the eye appear different (lightness/color contrast) and regions returning different spectra look similar (lightness/color constancy). Based on psychophysics and analyses of natural images, we have argued that such perceptual effects are signatures of the strategy vision uses to circumvent the inverse problem (1–4). By depending on the frequency of occurrence of biologically determined stimulus patterns, perceptions of lightness and color track reproductive success rather than the physical qualities of objects and conditions in the world, abrogating the need for information about the physical world as such. Here, we show that simulated evolution driven by the frequency of occurrence of spectral stimulus patterns gives rise to the key receptive field characteristic in biological color vision and to responses whose perceptual counterparts are color contrast and constancy.
Fig. 1.
Color contrast and constancy. (A) In any natural scene, the context of two patches identical in spectral intensity and power distribution can make the lightness and color of the patches look different (lightness/color contrast). (B) Same contexts can also make two spectrally different patches look similar (lightness/color constancy). The appearances of the targets in a neutral context are shown below [Reproduced from ref. 1 (Copyright 2003, Sinauer)].
Methods
Network.
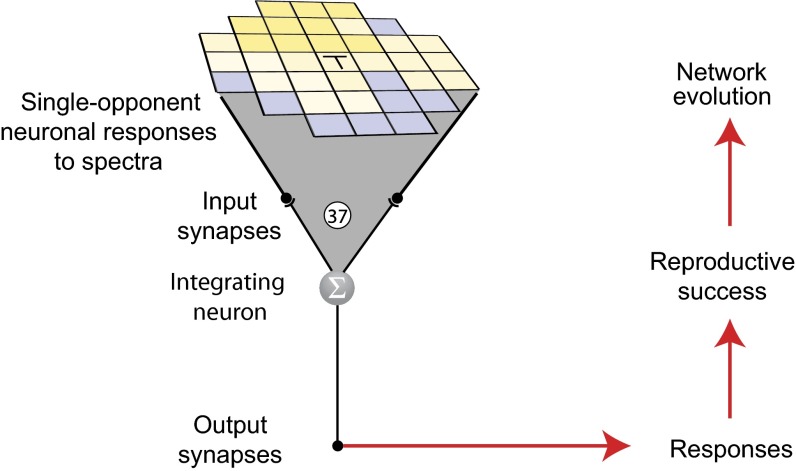
The network and evolutionary paradigm are shown in Fig. 2. The input to the network was the output of 37 single-opponent neurons that responded to equiluminant spectral patterns along the blue-yellow color axis of natural images. Although the choice of blue-yellow input rather than red-green was arbitrary, the color gamut of dichromats is based primarily on this axis (5). The input thus simulates the information provided to cortical neurons by single-opponent blue-yellow bipolar neurons, retinal ganglion cells, and lateral geniculate neurons. These input values to the network were nonlinearly transformed by evolvable synapses that converged on a single integrating neuron that summed the transformed values and conveyed the result to an output synapse, where the summed value was again nonlinearly transformed. All synapses were modeled as evolvable sigmoids expressed as:
Fig. 2.
Neural network. The network input consisted of 37 blue-yellow single-opponent neurons that forwarded responses to natural stimuli to an integrating neuron (Σ) that then conveyed the summed values to an output synapse that, in biological vision, would provide input to higher order visual processing stations. The blue-yellow single-opponent neural responses approached 1 when the dominant input was yellowish (LM wavelengths) and 0 when the dominant input was bluish (S wavelengths). The criterion of reproductive success was approximation of the output values to the cumulative frequencies of occurrence of the central target spectrum (T), given the spectra of the surrounding elements in the pattern.
where Post is the magnitude of the postsynaptic conductance change and Pre is the presynaptic membrane potential. The three free parameters were A, whose sign determines whether the synapse is excitatory or inhibitory, and B and C, which control the range of input values a given synapse could respond to (further details are provided in ref. 6). We limited the magnitude (absolute value) of the Pre and Post values to be positively correlated by constraining B and C such that they were positive. The free parameters were set to random numbers close to zero and were evolved so that the network output values matched accumulated visual experience (see Network Responses).
Single-Opponent Responses to Natural Spectral Patterns.
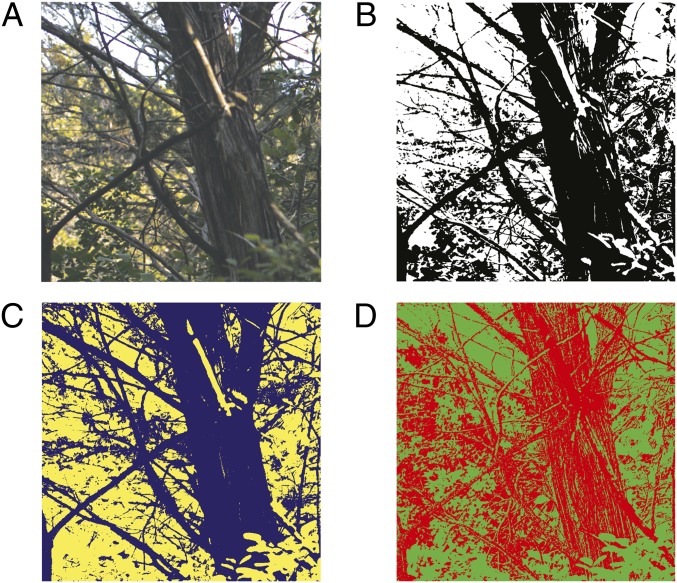
Three hundred and eight high-resolution natural red–green–blue (RGB) images from The University of Texas at Austin “set 1” database (7) served as a proxy for human spectral experience. The camera calibration data were used to convert the RGB pixel values into long–medium–short (LMS) cone activation values, defined as 2° cone fundamentals based on quantal Commission internationale de l'éclairage 10° color matching functions adjusted to 2° (8). To simulate the information provided by LMS cones to single-opponent neurons, the blue-yellow and red-green components were separately extracted from the images using principal components analysis to convert the log base 10 LMS cone activation values into lαβ color values (9–12) (Fig. 3). The “l” component corresponded to light intensity, α corresponded to spectral variation along the blue-yellow axis, and β corresponded to variation along the red-green axis (details are provided in SI Methods). The opponent values along these axes, which ranged from negative to positive, were remapped to range from 0 to 1. These remapped values thus simulated the responses of single-opponent neurons to natural spectra. In the relevant figures, these responses are shown as spectral stimulus patterns, with single-opponent responses dominated by LM wavelengths depicted in shades of yellow and responses dominated by S wavelengths depicted in shades of blue.
Fig. 3.
Decomposition of natural image spectra into separate color components. An image from the RGB database (A) was decomposed into l (B), α- (C), and β- (D) contributions. Each component was visualized by first converting LMS cone activation values into lαβ values thresholded to one of two intensities, depending on whether the original value was positive or negative. To visualize the components separately, all but the component of interest were reduced to small constant levels before conversion back to LMS values.
Frequency of Occurrence of Single-Opponent Responses.
The patterns extracted from the database were the single-opponent responses to blue-yellow (α) values (scaled from 0 to 1) that occurred most frequently in 1.5 million samples. Because relatively few patterns at this resolution were identical, we approximated the frequency of occurrence of central target values in different surrounds by averaging the original patterns into nine regions (eight regions around the central grid square) and binning the results into 16 groups (Fig. S1). The inputs presented to the networks were 23 possible central target values embedded in one of 200 different surrounds (Fig. S2). The 200 surrounds were chosen (without replacement) from 3,000 patterns that repeated at least 20 times in 1.5 million samples analyzed (details are provided in SI Methods).
Network Responses.
The reproductive rate assigned to the networks in each generation was determined by how well their output responses matched the relevant cumulative probability functions (Fig. S2C). These responses, ranked as percentiles, indicate, for a given target value, how often values in the context occurred more frequently than the value of interest and how often they occurred less frequently in cumulative experience. This response strategy has been shown to resolve ambiguity of luminance patterns, predicting human lightness perception without invoking feature extraction (13).
Simulated Evolution.
Ten simulations of evolution were run over 4,000 generations using populations of 200 networks. The network responses of the 37 single-opponent input neurons to 4,600 spectral stimulus patterns defined each network’s lifetime (i.e., 23 possible central target values in 200 different spectral surrounds; see above). Mating selection and reproduction rates were determined by roulette wheel assignment and random diversification (6). All simulations were carried out in MATLAB (MathWorks) using the Genetic Algorithm in the Global Optimization Toolbox.
Assessing the Receptive Field Properties of the Evolved Neurons.
The organization of fully evolved receptive fields in each simulation was determined by a method similar to classification image analysis (14).
Results
Evolved Responses.
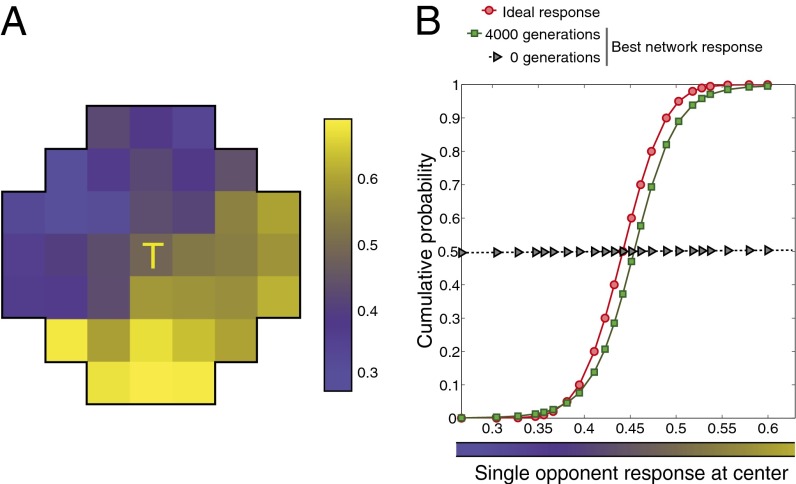
Because the criterion of evolutionary success was approximating the cumulative probability distribution function of the central target in a given pattern, the best-performing networks in each simulation should have evolved these output responses from the integrating neuron after many generations, as they did (Fig. 4).
Fig. 4.
Network evolution. (A) Example of one of the 4,600 inputs presented to each evolving network during its lifetime. The input values closer to 1 (primarily LM cone activation) are depicted in shades of yellow, and those closer to 0 (primarily S cone activation) are depicted in shades of blue (see color bar). The inputs mimic the responses of single-opponent blue-yellow neurons to natural spectra, responding relatively strongly in response to LM cone activation and weakly to S cone activation. (B) After 4,000 generations, the evolved network output values (green squares) closely matched the conditional cumulative probability distribution function (red circles) of the input at the central stimulus grid square, given the input values in the surround. The slope of the conditional cumulative distribution function at any point indicates the frequency of occurrence of one of the 23 possible values at the target location (T), given the surrounding input pattern. Gray triangles show the output responses before evolution.
Evolved Receptive Field Characteristics.
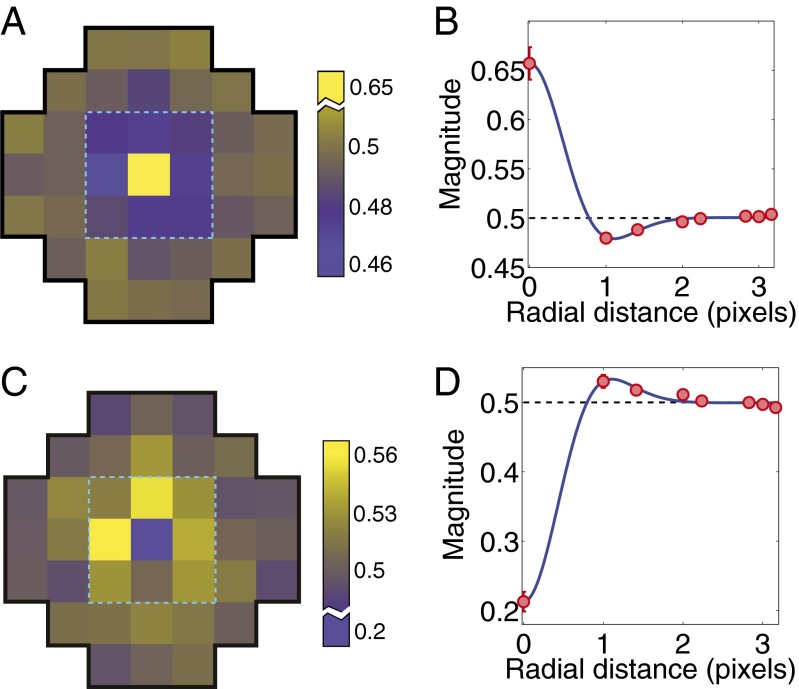
Fig. 5A shows the preferred input pattern determined by averaging more than 2,000 random single-opponent neural responses that caused the best-performing network in each of the 10 simulations of evolution to give a relatively strong response (>0.75). Values greater than 0.5 (yellow) indicate a preference for relatively long wavelengths, and values less than 0.5 (blue) indicate a preference for relatively short wavelengths. Fig. 5B shows the same results as radial averages (i.e., as a function of pixel distance). Fig. 5 C and D shows the receptive field map corresponding to the best networks’ nonpreferred input pattern, determined by averaging random single-opponent neural responses that led to weak responses (<0.25). The networks responded weakly to patterns that stimulate short-wavelength cones in the central region and longer wavelength cones in the surrounding region. Thus, networks evolved to approximate cumulative probability functions assigned stronger responses (closer to 1) when activated by relatively long wavelengths at the central target and relatively short wavelengths at the surrounding loci. The opposite result would have emerged if the evolutionary task had been to respond to S rather than LM cone increments. The networks that performed less well after evolution than the best-performing examples evolved generally similar receptive fields (Fig. S3). Finally, similar results were obtained using red-green single-opponent neural responses (Fig. S4).
Fig. 5.
Evolved double opponency. (A) Average receptive field based on random single-opponent responses that led to a strong output response (>0.75) for the best-performing network in the 10 simulated runs of evolution. Values greater than 0.5 indicate a preference for relatively longer wavelengths, whereas values less than 0.5 indicate a preference for relatively shorter ones. The evolved networks were relatively insensitive to inputs from information beyond the central region of the patterns (dashed outline). (B) Radial averages (red circles) of the receptive field that led to strong responses. The blue curve is a maximum likelihood fit to a difference of Gaussians function; error bars show ±1 SE. (C and D) Average receptive field that led to weak responses (<0.25) for the best-performing networks in the 10 simulations. Whether a network evolved a yellow (LM)-ON center (shown here) or a blue (S)-ON center receptive field depended on whether it evolved to match the conditional cumulative probability function of LM or S cone increments or of LM or S decrements. While the evolved double-opponent receptive received input from only one type of single opponent neuron [(LM)-ON neurons], in experimental animals the double-opponent receptive field center is signaled by strong activation arising from the input of one type of spectrally preferring single-opponent neurons and weak activation arising from spectrally opposite preferring type. Conversely, the surround is determined by the opposite input from single-opponent neurons.
In summary, the evolved networks showed the major characteristics of double-color opponent neurons found in experimental animals (15–19): (i) an overall chromatic opponency that allowed the networks to respond preferentially to LM wavelengths and nonpreferentially to S wavelengths, or vice versa, at a given spatial location; and (ii) a spatial chromatic opponency that allowed them to be specifically responsive to contrast between the spectral distribution of a given target in relation to the immediately surrounding spectra. The overall chromatic opponency is a consequence of the single-opponent input that has low values for S wavelengths and high vales for L wavelengths. Importantly, this characteristic was essential to the evolution of the spatial chromatic opponency and afforded the artificial neural network the ability to respond to the chromatic contrast between LM and S wavelengths rather than some other combination.
Color Contrast and Color Constancy.
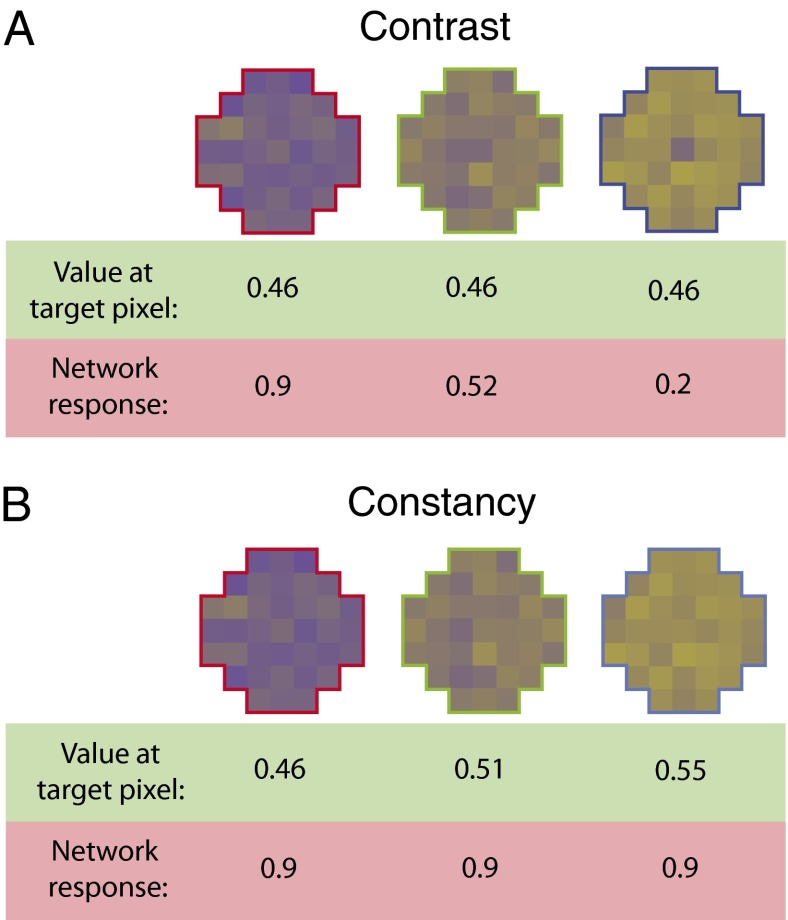
As noted by several investigators (18–22), double opponency provides a potential neural basis for simultaneous color contrast and color constancy in humans and other visual animals. Fig. 6 shows that in the present paradigm, contrast and constancy are automatic consequences of evolution driven by the conditional cumulative probability functions arising from experience. The reason is that spectra in retinal images, whether measured in α- or β-color space, have a higher probability of being the same at nearby retinal loci than at more distant ones (10). As a result, the evolved responses to spectra in the center of the network’s receptive field vary according to the surrounding spectral values, causing responses to the same target input to differ (color contrast; Fig. 6A) and responses to different target inputs to be more similar (color constancy; Fig. 6B, also Fig. 1). As explained in the following Discussion, these perceptual phenomena are thus the expected byproducts of a visual strategy based on circumventing the inverse problem by tracking reproductive success.
Fig. 6.
Generation of color contrast and constancy by the evolution of double-opponent circuitry. (A) Contrast. The evolved responses of an evolved yellow (LM)-ON network to patterns in which the input to the central target remains the same but the input to the surround varies from S cone domination (bluish; Left) to LM cone domination (yellowish; Right) are shown. As a result of double opponency, the network’s output varies when the same spectra activate the target. These responses accord with psychophysical observations, evident in the appearance of the central targets here, showing that the perception is biased toward yellow by blue surrounds (Left) and toward blue by yellowish surrounds (Right); the mixed surround (Center) has little effect. (B) Constancy. In this case, the input values activating the central target vary, whereas the surrounds remain the same, as in A (also Fig. 1). Thus, the network responses tend to remain the same despite variation in the target input.
Discussion
Despite our intuition to the contrary, the visual system does not take the measure of physical reality: The information it receives by means of photon energies cannot specify size, distance, orientation, surface reflectance, illumination, speed, direction, or any other parameters that we readily assess with the instruments of physics. The resulting quandary of how visual information might be mapped back onto the world, the inverse optics problem, is a particular case of the “one to many problems” that occur when the evidence in hand could have arisen in many different ways and information that could distinguish among them is not available. We have pointed out elsewhere (1–4) that because the frequency of occurrence of stimuli determined by evolution tracks reproductive success, the visual system can circumvent this problem. The aim of the present study is to show how evolved neural circuitry achieves this goal in the case of spectral information.
Evolved Strategy.
The evolutionary process that allows vision to circumvent the inverse problem is conventional: Some progeny in any generation will behave more successfully than others because of random variations of neural connectivity. Insofar as the more successful behaviors lead to relatively greater reproductive success, the underlying connectivity of that visual system will wax in the population because the inherited connections will be passed on to the next generation. Over time, the connectivity of the visual systems of the population becomes progressively more adept at responding to the demands of the world that cannot be apprehended. The same principle operates during ontogeny: Although improvements in behavior based on individual experience mediated by neural plasticity cannot be passed on, inheriting the mechanisms that enable individual learning and information storage adds to the increasing ability of a species to operate successfully in the world, again on the basis of reproductive success. The result is that both nature and nurture instantiate visual apparatus and circuitry that contend ever more effectively with the physical world despite its occult status.
From this perspective, perceptions and behavioral responses are reflexes, no different in kind from the automatic responses of “simpler” neural circuit responses to stimuli. There is no reason to suppose that vision depends on feature detection, neural representation or probabilistic (Bayesian) inferences; the operational success of randomly varying neural circuitry that is retained or not retained seems sufficient to contend with the fundamental problem of behaving in the world whose physical nature is effectively unknowable (1–4; also ref. 23).
Creation of Stimuli.
Beyond these conventional assertions, what then is the specific strategy that visual evolution has used to achieve this goal? The short answer is the creation of light energy patterns whose frequency of occurrence tracks reproductive success. Although these patterns are “stimuli,” their genesis is not what most psychologists and others take it to be. The word “stimulus” comes from the Latin for “cattle prod,” signifying the cause of a response. On the face of it, this concept of visual stimuli seems apt: Photon energy in the environment causes receptor cells in the retina to respond by well-understood phototransduction mechanisms. A general supposition is thus that the features of the resulting image convey the physical nature of the environment at that moment to subsequent stations in the visual processing chain. However, this passive concept of visual stimuli is misleading: It ignores the fact that vision and presumably other sensory systems cannot specify the parameters of the world in which behaviors must be executed.
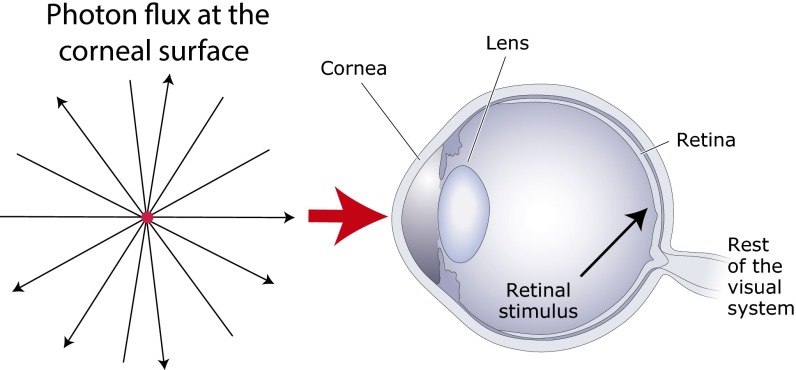
The difference between the cattle prod and visual stimuli is that the latter are actively created by biology. The visual observer symbolized by the eye in Fig. 7 is continually immersed in a sea of electromagnetic radiation that arises from a multitude of sources, only some of which arise from biologically pertinent objects and conditions. It is only after the evolved apparatus of the eye collects, focuses, and selects a particular fraction of this energy into a biologically determined pattern that a stimulus exists. This statement may seem obvious, but it is crucial in understanding how we respond appropriately to objects and conditions in the world whose physical character cannot be apprehended by biological visual systems. Although it is, of course, the case that physical objects and conditions in the world are part of the relevant causal chain, light stimuli are determined by a collaboration between physics and evolved biology.
Fig. 7.
Light stimuli created by the visual system. Although illuminated objects exist apart from observers, visual stimuli do not. Visual stimuli arise only after the evolved properties of the visual system create them by ordering the chaotic flux of photons that reaches the corneal surface at any given moment into ordered patterns whose evolved frequency of occurrence indexes reproductive success.
Double-Opponent Neurons.
The key to this strategy in the case of color contrast and constancy is the evolution of double opponency. Double-opponent neurons are found in a variety of experimental animals, including primates (15–19, 24–26), and they provide a plausible basis for color contrast and constancy (19–22). In the case of a yellow (LM)-ON double-opponent neuron (Fig. 5), color contrast arises when relatively long wavelengths presented to both the receptive field center and surround cause the neuron to fire at a lower rate compared with another neuron of the same type receiving the same central target stimulation but shorter wavelengths in its surround (compare Fig. 6A, Left and Right). Conversely, color constancy arises when different spectra at the central target and surround cause the neuron to fire at roughly the same rate despite different spectral input (Fig. 6B).
To understand how double-opponent circuitry gives rise to these response properties, consider the cumulative probability function in Fig. 4B. The function in red ranks the frequency of occurrence of single-opponent inputs at the target in a given surrounding pattern drawn from natural images. The green curve indicates the evolved output responses of the network. Given the spatial correlation of spectral values created by the evolution of retinal topography, the most frequently occurring target wavelength in the input patterns will have been about the same as wavelengths that have an impact on the surround. The output values of a network mediated by the evolution of double opponency track these frequencies of occurrence of the input patterns. Thus, for responses that rank low on the function, the wavelengths at the target location are shorter than those that affect the surround. This lower rank leads to less activation of the center and a reduced network response. In the case of a midrank response (i.e., when the target and surround receive about equal distributions of spectral power), the activation from the neuron’s excitatory and inhibitory regions is about the same, leading to a midrange output value. In the case of a response ranked high on the function, the spectral distribution of the target values is affected by longer wavelengths than the surround. This higher rank leads to greater activation of the center, and thus a stronger response arising from the evolved network. In biological visual systems, as in the artificial paradigm, double-opponent circuitry allows neural responses to track reproductive success rather than stimulus features, thus overcoming the inverse optics problem as it pertains to spectral ambiguity.
Lightness Contrast and Constancy.
A final point concerns the adequacy of single-opponent neurons for understanding achromatic contrast. In this circumstance, the responses to the cone inputs are proportional to luminance. Thus, the equivalent of chromatic double opponency—input that would automatically lead to lightness contrast and constancy—already exists at the level of the single-opponent neurons that underlie responses to achromatic retinal stimuli.
Conclusion
The rationale for contrast and constancy given in many textbooks is that contrast improves the ability of a visual agent to distinguish among surfaces, whereas constancy promotes the identification of the same surface reflectance in different conditions of illumination. Based on the present results, however, contrast and constancy are consequences of a more basic purpose, namely, contending with the conflation of spectral information in retinal stimuli. Evolution appears to have resolved this problem by actively creating patterns of light energy whose frequencies of occurrence directly link perceptual and behavioral responses with reproductive success (4). Thus, the discrepancies between measured spectral values and perceived color or lightness evident in contrast and constancy, or any other visual qualities and their physical correlates, should not be thought of as anomalies or “illusions” but as signatures of the strategy that we and presumably other visual animals have evolved to promote useful behaviors despite the inability of biological visual systems to measure physical parameters. Successful behavior arises not because the properties of the world are recovered from images but because the perceptual values assigned by evolution and the behaviors that automatically follow accord with reproductive success.
Supplementary Material
Acknowledgments
We thank Cherlyn Ng, Brian Monson, Janani Sundararajan, and Chidambaram Yeggapan for helpful discussions and suggestions. This work was supported by the Duke-National University of Singapore Graduate Medical School (Grant BCS-0924181; www.duke-nus.edu.sg).
Footnotes
The authors declare no conflict of interest.
This paper results from the Arthur M. Sackler Colloquium of the National Academy of Sciences, “In the Light of Evolution VIII: Darwinian Thinking in the Social Sciences,” held January 10–11, 2014, at the Arnold and Mabel Beckman Center of the National Academies of Sciences and Engineering in Irvine, CA. The complete program and audio files of most presentations are available on the NAS website at www.nasonline.org/ILE-Darwinian-Thinking.
This article is a PNAS Direct Submission.
This article contains supporting information online at www.pnas.org/lookup/suppl/doi:10.1073/pnas.1402669111/-/DCSupplemental.
References
- 1.Purves D, Lotto B. Why We See What We Do: An Empirical Theory of Vision. Sunderland, MA: Sinauer; 2003. [Google Scholar]
- 2.Purves D, Lotto B. Why We See What We Do Redux: A Wholly Empirical Theory of Vision. Sunderland, MA: Sinauer; 2011. [Google Scholar]
- 3.Purves D, Wojtach WT, Lotto RB. Understanding vision in wholly empirical terms. Proc Natl Acad Sci USA. 2011;108(Suppl 3):15588–15595. doi: 10.1073/pnas.1012178108. [DOI] [PMC free article] [PubMed] [Google Scholar]
- 4.Purves D, Monson BB, Sundararajan J, Wojtach WT. How biological vision succeeds in the physical world. Proc Natl Acad Sci USA. 2014;111(13):4750–4755. doi: 10.1073/pnas.1311309111. [DOI] [PMC free article] [PubMed] [Google Scholar]
- 5.Jacobs GH. Primate color vision: A comparative perspective. Vis Neurosci. 2008;25(5-6):619–633. doi: 10.1017/S0952523808080760. [DOI] [PubMed] [Google Scholar]
- 6.Ng C, Sundararajan J, Hogan M, Purves D. Network connections that evolve to circumvent the inverse optics problem. PLoS ONE. 2013;8(3):e60490. doi: 10.1371/journal.pone.0060490. [DOI] [PMC free article] [PubMed] [Google Scholar]
- 7.Geisler WS, Perry JS. Statistics for optimal point prediction in natural images. J Vis. 2011;11(12):14. doi: 10.1167/11.12.14. [DOI] [PMC free article] [PubMed] [Google Scholar]
- 8.Stockman A, MacLeod DIA, Johnson NE. Spectral sensitivities of the human cones. J Opt Soc Am A Opt Image Sci Vis. 1993;10(12):2491–2521. doi: 10.1364/josaa.10.002491. [DOI] [PubMed] [Google Scholar]
- 9.Ruderman DL, Cronin TW, Chiao C. Statistics of cone responses to natural images: Implications for visual coding. J Opt Soc Am A Opt Image Sci Vis. 1998;15:2036–2045. [Google Scholar]
- 10.Fine I, MacLeod DIA, Boynton GM. Surface segmentation based on the luminance and color statistics of natural scenes. J Opt Soc Am A Opt Image Sci Vis. 2003;20(7):1283–1291. doi: 10.1364/josaa.20.001283. [DOI] [PubMed] [Google Scholar]
- 11.Ing AD, Wilson JA, Geisler WS. Region grouping in natural foliage scenes: Image statistics and human performance. J Vis. 2010;10(4):1–19. doi: 10.1167/10.4.10. [DOI] [PMC free article] [PubMed] [Google Scholar]
- 12.DiMattina C, Fox SA, Lewicki MS. Detecting natural occlusion boundaries using local cues. J Vis. 2012;12(13):1–21. doi: 10.1167/12.13.15. [DOI] [PMC free article] [PubMed] [Google Scholar]
- 13.Yang Z, Purves D. The statistical structure of natural light patterns determines perceived light intensity. Proc Natl Acad Sci USA. 2004;101(23):8745–8750. doi: 10.1073/pnas.0402192101. [DOI] [PMC free article] [PubMed] [Google Scholar]
- 14.Murray RF. Classification images: A review. J Vis. 2011;11(5):1–25. doi: 10.1167/11.5.2. [DOI] [PubMed] [Google Scholar]
- 15.Michael CR. Color vision mechanisms in monkey striate cortex: Dual-opponent cells with concentric receptive fields. J Neurophysiol. 1978a;41(3):572–588. doi: 10.1152/jn.1978.41.3.572. [DOI] [PubMed] [Google Scholar]
- 16.Michael CR. Color vision mechanisms in monkey striate cortex: Simple cells with dual opponent-color receptive fields. J Neurophysiol. 1978b;41(5):1233–1249. doi: 10.1152/jn.1978.41.5.1233. [DOI] [PubMed] [Google Scholar]
- 17.Livingstone MS, Hubel DH. Anatomy and physiology of a color system in the primate visual cortex. J Neurosci. 1984;4(1):309–356. doi: 10.1523/JNEUROSCI.04-01-00309.1984. [DOI] [PMC free article] [PubMed] [Google Scholar]
- 18.Conway BR. Spatial structure of cone inputs to color cells in alert macaque primary visual cortex (V-1) J Neurosci. 2001;21(8):2768–2783. doi: 10.1523/JNEUROSCI.21-08-02768.2001. [DOI] [PMC free article] [PubMed] [Google Scholar]
- 19.Conway BR, Livingstone MS. Spatial and temporal properties of cone signals in alert macaque primary visual cortex. J Neurosci. 2006;26(42):10826–10846. doi: 10.1523/JNEUROSCI.2091-06.2006. [DOI] [PMC free article] [PubMed] [Google Scholar]
- 20.Daw NW. Goldfish retina: Organization for simultaneous color contrast. Science. 1967;158(3803):942–944. doi: 10.1126/science.158.3803.942. [DOI] [PubMed] [Google Scholar]
- 21. Gouras P (1991) Color vision. Principles of Neural Science, eds Kandel ER, Schwartz JH, Jessell TM (Prentice-Hall, CT), pp 467–479.
- 22.Shapley R, Hawken MJ. Color in the cortex: Single- and double-opponent cells. Vision Res. 2011;51(7):701–717. doi: 10.1016/j.visres.2011.02.012. [DOI] [PMC free article] [PubMed] [Google Scholar]
- 23.Mark JT, Marion BB, Hoffman DD. Natural selection and veridical perceptions. J Theor Biol. 2010;266(4):504–515. doi: 10.1016/j.jtbi.2010.07.020. [DOI] [PubMed] [Google Scholar]
- 24.Johnson EN, Hawken MJ, Shapley R. The spatial transformation of color in the primary visual cortex of the macaque monkey. Nat Neurosci. 2001;4(4):409–416. doi: 10.1038/86061. [DOI] [PubMed] [Google Scholar]
- 25.Johnson EN, Hawken MJ, Shapley R. Cone inputs in macaque primary visual cortex. J Neurophysiol. 2004;91(6):2501–2514. doi: 10.1152/jn.01043.2003. [DOI] [PubMed] [Google Scholar]
- 26.Johnson EN, Hawken MJ, Shapley R. The orientation selectivity of color-responsive neurons in macaque V1. J Neurosci. 2008;28(32):8096–8106. doi: 10.1523/JNEUROSCI.1404-08.2008. [DOI] [PMC free article] [PubMed] [Google Scholar]


