Figure 8.
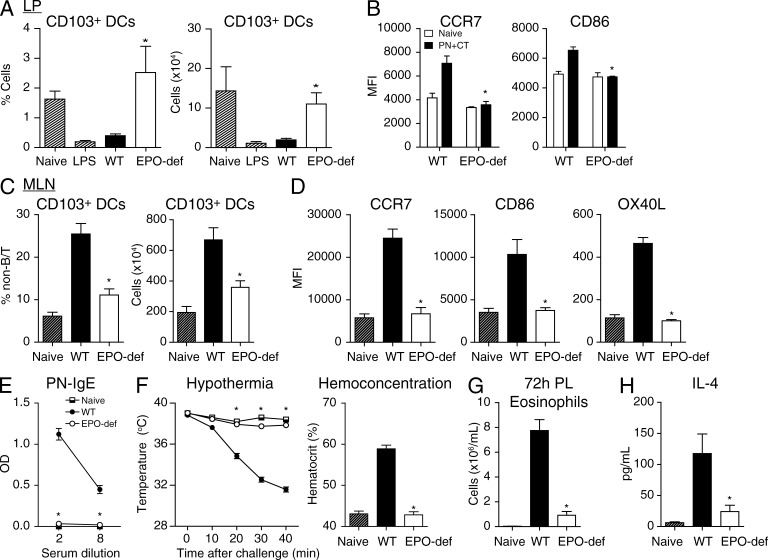
EPO controls CD103+ DC migration, activation, and induction of Th2 immunity in vivo. WT or EPO-deficient mice were kept naive or (A) administered LPS i.p. 16 h before analysis, or (A–D) PN+CT i.g. daily for 3 d or (E–H) weekly for 4 wk. (A) Proportion and number of CD103+ DCs in SI LP. (B) Activation status of SI DCs. (C) Proportion and number of CD103+ DCs in the MLN. (D) CCR7, CD86, and OX40L expression. (E) Serum PN-IgE at week 5. (F) Clinical anaphylactic hypothermia and hemoconcentration. (G) Peritoneal eosinophilic inflammation 72 h after i.p. challenge. (H) Th2 cytokine production. Mean ± SEM, n = 3–8 from 2–3 experiments. *, P < 0.05 versus WT.

